

Review
doi: 10.1136/hrt.2004.041194.
Radionuclide imaging in risk assessment after acute coronary syndromes
Affiliations
- PMID: 15254005
- PMCID: PMC1876322
- DOI: 10.1136/hrt.2004.041194
Item in Clipboard
Review
Radionuclide imaging in risk assessment after acute coronary syndromes
Heart.
2004 Aug.
No abstract available
Figures
SPECT resting Tc 99m sestamibi imaging of a 39 year old man who presented to the ED with chest pain, atypical for angina and a near normal initial ECG. The images demonstrate a severe resting perfusion defect in the inferolateral wall. As a result of these findings and of ongoing symptoms, he was taken to the catheterisation laboratory, where an acute left circumflex occlusion was found and treated with primary angioplasty.
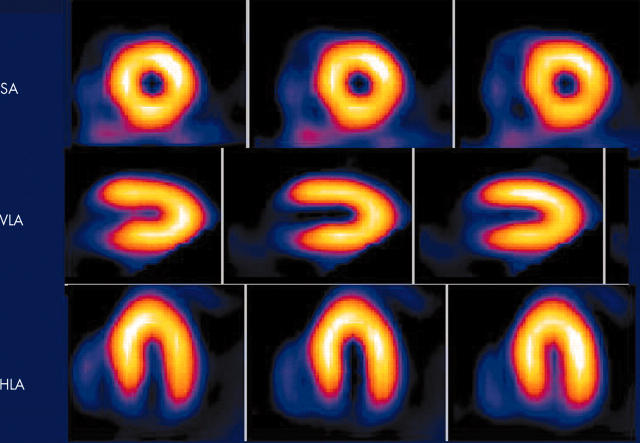
Short axis, vertical and horizontal long axis SPECT images of a 52 year old man who presented to the ED with chest pain atypical for angina and a initial ECG with non-specific ST segment abnormalities not diagnostic for acute ischaemia. He was injected with tc 99m-sestamibi at rest in the ED, and underwent SPECT imaging in the nuclear cardiology laboratory soon thereafter. The images show a completely normal resting perfusion pattern, and the gated SPECT imaging of resting LV function (not shown) was also normal. This finding is associated with a very low probability of MI and acute ischaemic syndrome, suggesting that such a patient may be discharged directly from the ED.
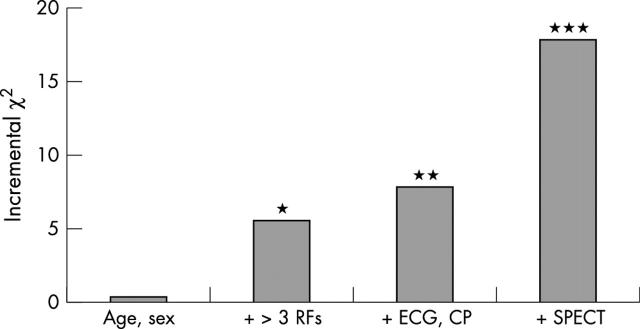
Analysis of the incremental value of resting perfusion imaging data to predict cardiac events in ED patients with suspected ischaemia. The incremental χ2 value (y axis) measures the strength of the association between individual factors added to the knowledge base in incremental fashion (x axis) and unfavourable cardiac events. Addition of SPECT perfusion imaging data adds highly significant value even with knowledge of age, sex, risk factors for coronary artery disease, ECG changes and presence or absence of chest pain. Adapted from Heller and colleagues.15
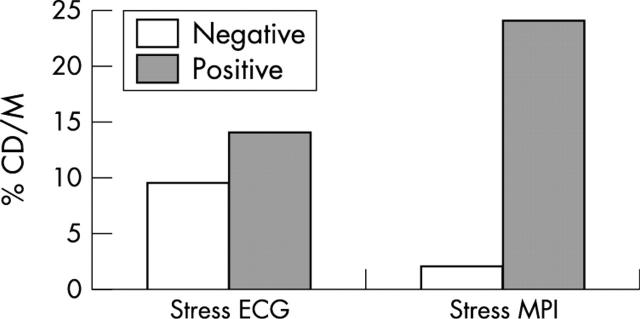
Data supporting the use of MPI as the decision point in a conservative management strategy in patients with non-ST segment elevation ACS. The predictive value of stress MPI and stress electrocardiography (stress ECG) is shown in patients studied after initial stabilisation of UA with medical therapy. This figure summarises the results of three studies in which the incidence of cardiac death or non-fatal MI were assessed as end points (% CD/M on y axis) during follow up after stabilisation of UA. The presence of reversible perfusion defects reflective of ischaemia (positive stress MPI) was strongly predictive of cardiac events in this setting; the absence of inducible ischaemia on MPI (negative stress MPI) identifies a low risk group suggesting that such patients can be managed conservatively. Data are less consistent on the use of exercise electrocardiography in this setting. Adapted from Brown.33
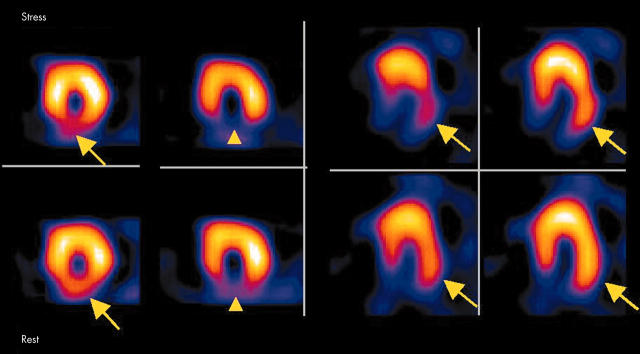
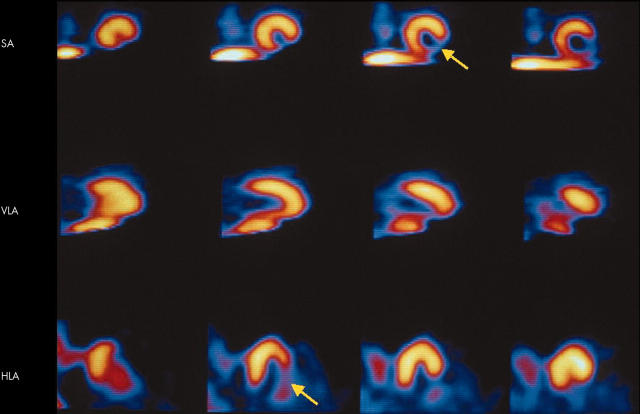
Positive MPI study in a patient with medically stabilised UA. After presentation, symptoms were controlled with initial medical therapy, and stress MPI was performed. There is evidence of an inferobasal infarct (arrowhead) but the large extent of inducible ischaemia involving the inferoapical and lateral walls (arrows) suggests high risk for future events, and the patient was subsequently referred for catheterisation.
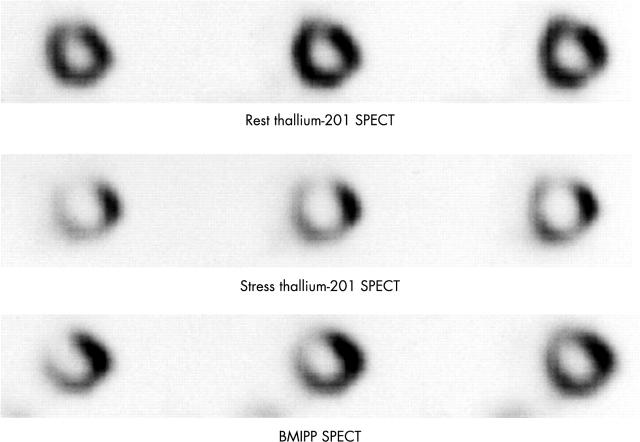
Radiolabelled iodinated fatty acid analogue, BMIPP, used to assess fatty acid utilisation in the myocardium. In this example, the top row depicts normal resting perfusion by thallium 201 SPECT imaging, in short axis tomograms. The middle row demonstrates extensive stress induced thallium 201 perfusion abnormalities consistent with inducible ischaemia of the anterior, septal, and inferior walls. In the bottom row, the BMIPP SPECT images of the analogous short axis tomograms, obtained at rest, demonstrate ongoing abnormality in fatty acid metabolism in the anterior wall, septum and inferior wall, temporally distinct from the presenting ischaemic insult. Thus, this technique may provide risk stratification information based on the magnitude of abnormal fatty acid metabolism using rest imaging alone without the need for a stress test. This concept is currently under study. Adapted from Kawai and colleagues,39 images provided by Dr Nagara Tamaki, with permission.
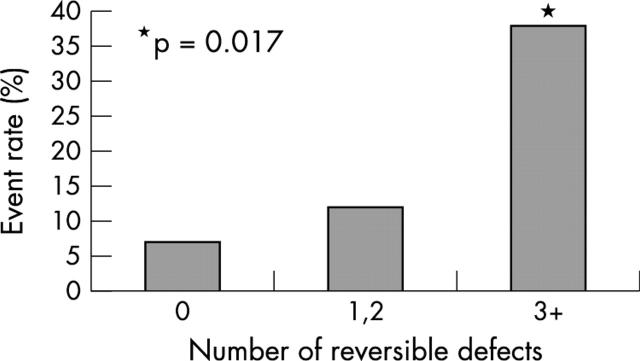
Relation between the post-MI extent of ischaemia (as determined by the number of perfusion defects by SPECT Tc 99m sestamibi) with cardiac event rate (y axis). Patients with more extensive ischaemia are at progressively higher risk of unfavourable outcome (p = 0.017) compared with patients with no reversible defects. From Travin and colleagues.45
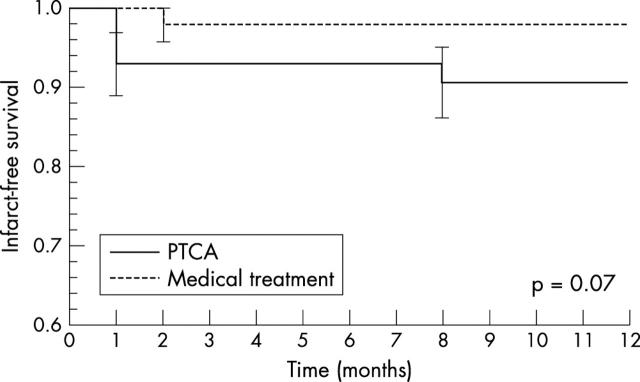
In a study by Ellis and colleagues, patients who had received thrombolytic therapy for acute MI who had a residual stenosis of the infarct related artery but no inducible ischaemia in the infarct territory by MPI were randomised to either a strategy of percutaneous transluminal coronary angioplasty (PTCA) of the residual stenosis or a strategy of no PTCA. Shown is a plot of actuarial freedom from cardiac events after randomisation to PTCA (solid line) or medical therapy (dashed line). There is no difference in outcome between the groups. Hence, identification of inducible ischaemia or lack thereof within the infarct zone by perfusion imaging after acute MI and reperfusion therapy can guide management decisions regarding revascularisation strategy. In the absence of any residual infarct zone ischaemia, there appears little benefit from a strategy of revascularisation. From Ellis and colleagues.49
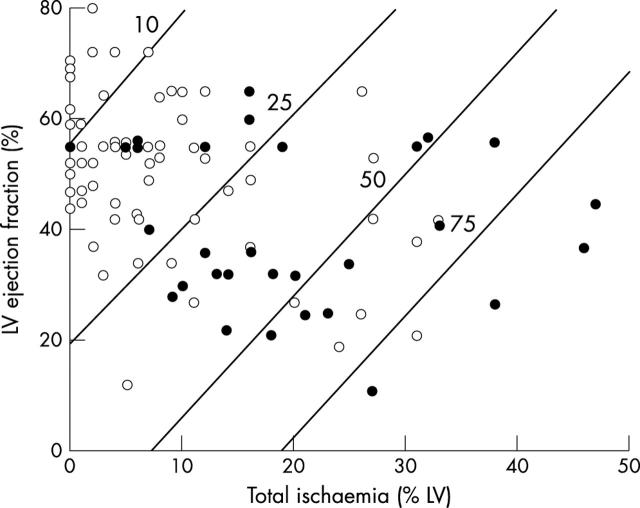
Cox regression models displaying one year post-MI risk for cardiac event according to LV ejection fraction and total LV ischaemia. The diagonal lines are representative of isobars of per cent risk of event. Patient risk for any cardiac event increases as total LV ischaemia increases and LV ejection fraction decreases. LV ejection fraction and scintigraphic results for each of 92 patients who did (solid circles) or did not (open circles) have subsequent cardiac events over entire follow up period are plotted against calculated risk at one year. From Mahmarian and colleagues.46
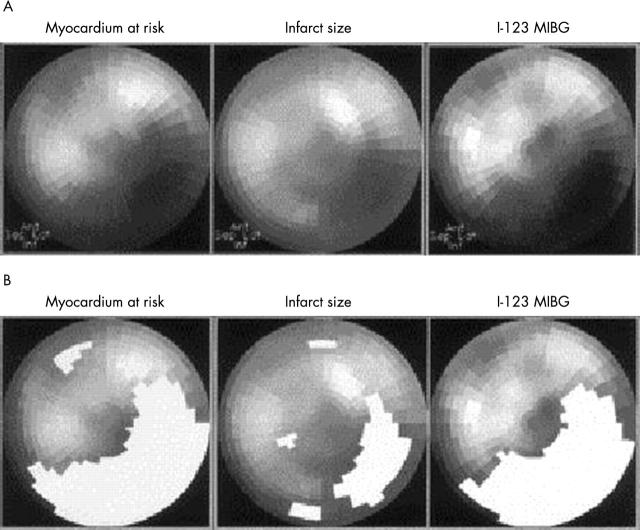
Use of MIBG imaging of cardiac sympathetic innervation. In a study of acute MI patients, the territory of sympathetic denervation (MIBG defect, polar map images in right columns in panels A and B) corresponded more closely to the initial MI risk area (polar map images in left columns) than the final infarct size (polar map images in middle columns). From Matsunari and colleagues.60
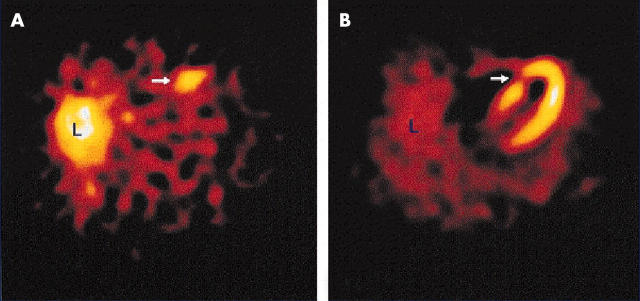
Anteroseptal uptake of Tc 99m labelled annexin-V is seen (left panel) in the territory of a resting perfusion defect consistent with the infarct zone (right panel). Reprinted from Hofstra and colleagues,61 with permission.
Similar articles
-
Assessment of prognosis in chronic coronary artery disease.Heart. 2004 Aug;90 Suppl 5(Suppl 5):v10-5. doi: 10.1136/hrt.2003.018770. Heart. 2004. PMID: 15254004 Free PMC article. Review. No abstract available.
-
Impact of diabetes mellitus on prediction of clinical outcome after coronary revascularization by 18F-FDG SPECT in patients with ischemic left ventricular dysfunction.J Nucl Med. 2006 Jan;47(1):68-73. J Nucl Med. 2006. PMID: 16391189 Clinical Trial.
-
[Chest pain syndrome in normal or non-diagnostic conventional ECG at the emergency service. Assessment with myocardial perfusion (SPECT) and ventricular function (Gated-SPECT)].Arch Cardiol Mex. 2004 Jan-Mar;74 Suppl 1:S18-31. Arch Cardiol Mex. 2004. PMID: 15216744 Review. Spanish.
-
Comparison of scintigraphic and echocardiographic methods in coronary heart disease.Am J Card Imaging. 1992 Mar;6(1):71-80; discussion 81-2. Am J Card Imaging. 1992. PMID: 10147616 Review. No abstract available.
-
The additive value of combined assessment of myocardial perfusion and ventricular function studies.J Nucl Med. 2004 Oct;45(10):1721-4. J Nucl Med. 2004. PMID: 15471840 Review.
Cited by
-
Incremental diagnostic value of regional left ventricular function over coronary assessment by cardiac computed tomography for the detection of acute coronary syndrome in patients with acute chest pain: from the ROMICAT trial.Circ Cardiovasc Imaging. 2010 Jul;3(4):375-83. doi: 10.1161/CIRCIMAGING.109.892638. Epub 2010 May 19. Circ Cardiovasc Imaging. 2010. PMID: 20484542 Free PMC article.
References
Publication types
MeSH terms
LinkOut - more resources
Full Text Sources