. 2004 Sep 15;559(Pt 3):739-50.
doi: 10.1113/jphysiol.2004.065391. Epub 2004 Jul 14.

Human TRPC5 channel activated by a multiplicity of signals in a single cell

Affiliations

Human TRPC5 channel activated by a multiplicity of signals in a single cell

Fanning Zeng et al. J Physiol. .

Erratum in

  • J Physiol. 2004 Nov 1;560(Pt 3):950

Abstract

Here we explore the activation mechanisms of human TRPC5, a putative cationic channel that was cloned from a region of the X chromosome associated with mental retardation. No basal activity was evident but activity was induced by carbachol stimulation of muscarinic receptors independently of Ca2+ release. This is 'receptor activation', as described for mouse TRPC5. In addition, and in the absence of receptor stimulation, extracellular gadolinium (0.1 mm) activated TRPC5, an effect that was mimicked by 5-20 mm extracellular Ca2+ with intracellular Ca2+ buffered. We refer to this as 'external ionic activation'. TRPC5 was also activated by modest elevation of [Ca2+]i in the absence of GTP--'calcium activation'. A putative fourth activation mechanism is a signal from depleted intracellular Ca2+ stores. Consistent with this idea, human TRPC5 was activated by a standard store-depletion/Ca2+ re-entry protocol, an effect that was difficult to explain by calcium activation. Multiplicity of TRPC5 activation was demonstrated in single cells and thus not dependent on heterogeneity of expression levels or cellular context. Therefore, human TRPC5 is activated by a range of stimuli, avoiding dependence on a single critical activator as in many other ion channels. One of these stimuli would seem to be a change in Ca2+ handling by the endoplasmic reticulum.


Figures
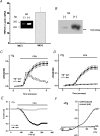
Figure 1
Figure 1. Expression and receptor activation of human TRPC5
A, over-expression of TRPC5 RNA in response to tetracycline induction. RNA was quantified by real-time PCR and expressed relative to the amount of RNA encoding β-actin. TRPC5 PCR products were analysed by gel electrophoresis (inset). The predicted amplicon was 275 bp. B, Western blot of the whole lysates from HEK-TRPC5 cells. The blot was probed with T5C3 antibody. TRPC5 predicted mass is 111 kDa. tet+ indicates TRPC5-induced cells, tet− indicates non-induced cells. C and D, stimulation of endogenous muscarinic receptors activates TRPC5. Gd3+ (10 μm) was present during the fura-PE3-wash period and throughout the experiments. Cells were washed in Ca2+-free solution without (C) or with (D) 1 μm thapsigargin (Tg) for 30 min, then perfused with standard (1.5 mm Ca2+) bath solution followed by the addition of 100 μm carbachol (CCH). The change in Ca2+ signal in response to CCH is shown. C, n = 120(4) for tet+ cells, and 120(4) for tet− cells. D, n = 140(3) for tet+ cells and 115(3) for tet− cells. E, whole-cell current induced by 100 μm CCH in a TRPC5-expressing (tet+) or control (tet−) cell pre-treated with 1 μm thapsigargin (+ Tg) and with 200 nm free Ca2+ in the patch pipette solution. Cells were superfused with standard bath solution. The voltage protocol was a 1-s ramp from −100 to +100 mV applied at 0.1 Hz from a holding potential of −60 mV. Current was sampled at −80 mV. F, for the experiments in (E), current–voltage relationships for the CCH-induced current. A similar current was induced by CCH in two other tet+ cells.
Figure 2
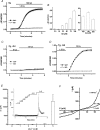
Figure 2. External ionic activation
A and D show that TRPC5 is activated by external Gd3+ or Ca2+. Cells were pre-incubated in 1.5 mm Ca2+ solution for 30 min before 100 μm Gd3+ (A) or 10 mm Ca2+ (D) was added. A, n = 118(4) for tet+ cells and 81(3) for tet− cells. C, n = 65(3) for tet+ cells and 52(3) for tet− cells. B, concentration–response relationship for activation of TRPC5 by Gd3+. Experiments were carried out using the same protocol as (A) except different concentrations of Gd3+ were applied. Two panels are shown because data were collected from two batches of cells n = 40–60(3) for each data point. C, cells were incubated in Ca2+- and EGTA-free solution for 20 min, followed by re-application of 1.5 mm Ca2+ solution: n = 119(4) for tet+ cells, n = 101(3) for tet− cells. E, whole-cell current induced by different concentration of external Ca2+; values are mean ±s.e.m. (n = 7). Current was sampled at +80 mV during a 0.2-s ramp from −100 mV to +100 mV applied at 0.1 Hz from a holding potential of −60 mV. The inset panel shows a time-series plot for a typical experiment. F, for one of the experiments summarized in (E), current–voltage relationships for current evoked by 0.1, 1.5 or 5 mm Ca2+.
Figure 3
Figure 3. Intracellular Ca2+ activation
A, whole cell currents at −80 mV following break-through to the whole-cell with patch pipette solution containing 0 (n = 6) or 200 nm Ca2+ (n = 8). Cells were perfused with standard bath solution. The voltage protocol was a 1-s ramp from −100 to +100 mV applied at 0.1 Hz from a holding potential of −60 mV; values are mean ±s.e.m. B, representative current–voltage relationships for currents induced after 10 min of whole-cell recording.
Figure 4
Figure 4. Store-operated properties
A and B, cells were washed in Ca2+ free solution containing 0.4 mm EGTA for 30 min with (A) or without (B) 1 μm Tg, followed by addition of 3 mm Ca2+ to the bath solution. A, n = 65(3) for tet+ cells and n = 42(3) for tet− cells. B, n = 94(3) for both tet+ and tet− cells. C and D, 10 μm Gd3+ was present during the fura-PE3-wash period and throughout the experiments. Cells were washed in Ca2+- and EGTA-free solution with (C) or without (D) 1 μm Tg for 30 min, followed by addition of 1.5 mm Ca2+ to the bath solution. C, n = 140(5) for tet+ cells and 139(5) for tet− cells; D, n = 120(4) for both groups. Washing cells for 30 min with Ca2+-free solution (Tg-free) did not deplete stores, as indicated by the fact that the Ca2+-release signal evoked by carbachol in the absence of extracellular Ca2+ was not significantly altered (n = 3, data not shown).
Figure 5
Figure 5. Relationship between store-operated properties and Ca2+ activation
A and B, experiments were carried out in Ca2+-free conditions. Cells were pre-incubated in Ca2+-free solution containing 0.4 mm EGTA, with (A) or without (B) Tg for 30 min. The cells were then perfused with Ca2+- and EGTA-free solution containing 100 μm Gd3+ for 2 min, followed by the addition of 0.5 mm Ba2+. A, n = 119(4) for tet+ cells and n = 107(4) for tet− cells; B, n = 108(3) for tet+ cells and 94(3) for tet− cells. CD, induction of TRPC5 current by the SERCA inhibitor cyclopiazonic acid (CPA). C, whole-cell currents in two representative cells, one without (tet−) and one with TRPC5 (tet+), and both measured with 200 nm free Ca2+ in the patch pipette solution. The voltage protocol was a 1-s ramp from −100 to +100 mV applied at 0.1 Hz from a holding potential of −60 mV. Current was sampled during the ramp at −80 mV. D, for the same cells as (C), typical CPA-induced currents for tetracycline-induced and control cells. The traces have been smoothed by averaging of each consequent group of five adjacent data points.
Figure 6
Figure 6. Multiplicity of activation in single HEK293 cells
AC, ratiometric images of fura-PE3 signals in TRPC5-induced cells. Ca2+ stores were depleted using Tg, and Gd3+ 10 μm was present throughout the experiment. [Ca2+]i is indicated on a rainbow scale with blue representing low [Ca2+]i and orange/red high [Ca2+]i. The scale bar in A is 20 μm. For a single experiment the cells are shown in the absence of extracellular Ca2+ (A), after re-application of 1.5 mm Ca2+ (B), and after addition of 100 μm CCH (C). Numbers/arrows in AC relate to those in D. D, from the experiment shown in AC, time-series plots of the change in R340/380 (ΔR340/380) for five separate cells, showing responses to re-application of Ca2+ and to CCH. EGTA was excluded from all solutions. E and F, TRPC5 induced (E) or non-induced (F) cells were washed in 1.5 mm Ca2+ solution for 30 min, then perfused in the same solution containing 25 μm Gd3+, followed by the addition of 100 μm CCH. Traces for five isolated cells were shown in each case.

References

    1. Barritt GJ. Receptor-activated Ca2+ inflow in animal cells: a variety of pathways tailored to meet different intracellular Ca2+ signalling requirements. Biochem J. 1999;337:153–169. - PMC - PubMed
    1. Beech DJ, Xu SZ, McHugh D, Flemming R. TRPC1 store-operated cationic channel subunit. Cell Calcium. 2003;33:433–440. - PubMed
    1. Casteels R, Droogmans G. Exchange characteristics of the noradrenaline-sensitive calcium store in vascular smooth muscle cells or rabbit ear artery. J Physiol. 1981;317:263–279. - PMC - PubMed
    1. Clapham DE. TRP channels as cellular sensors. Nature. 2003;426:517–524. - PubMed
    1. Cui J, Bian JS, Kagan A, McDonald TV. CaT1 contributes to the stores-operated calcium current in Jurkat T-lymphocytes. J Biol Chem. 2002;277:47175–47183. - PubMed

Publication types

MeSH terms