

Cholinergic regulation of the evoked quantal release at frog neuromuscular junction
- PMID: 15254150
- PMCID: PMC1665191
- DOI: 10.1113/jphysiol.2004.065805
Cholinergic regulation of the evoked quantal release at frog neuromuscular junction
Abstract
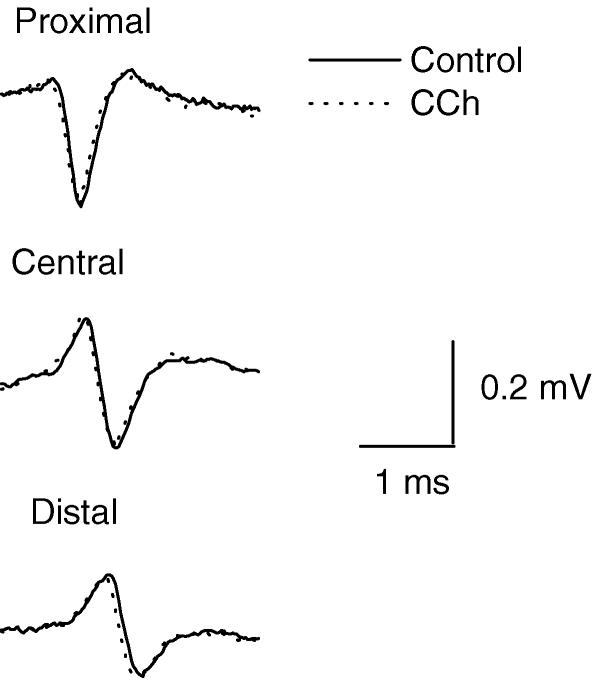
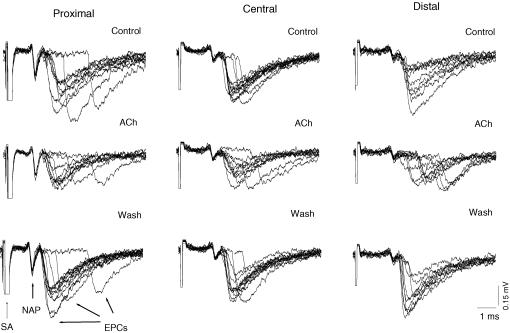
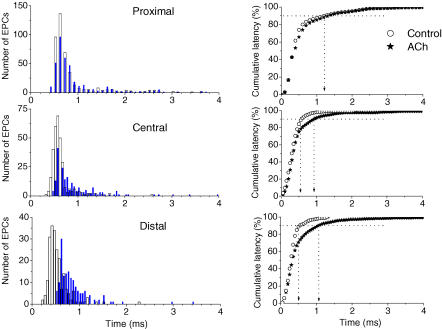
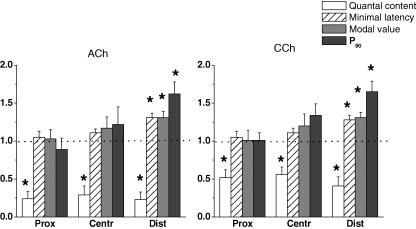
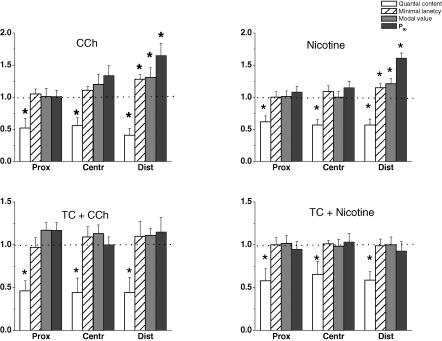
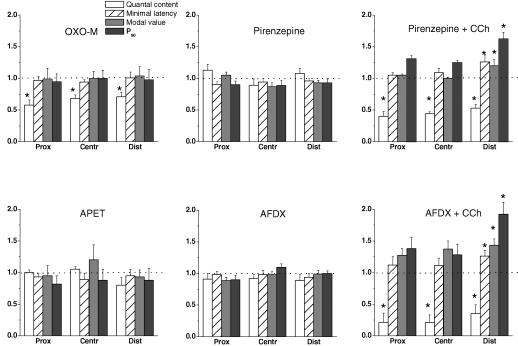
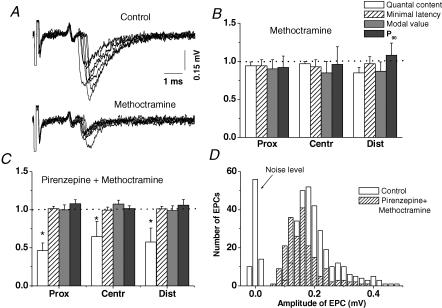
The effects of cholinergic drugs on the quantal contents of the nerve-evoked endplate currents (EPCs) and the parameters of the time course of quantal release (minimal synaptic latency, main modal value of latency histogram and variability of synaptic latencies) were studied at proximal, central and distal regions of the frog neuromuscular synapse. Acetylcholine (ACh, 5 x 10(-4) M), carbachol (CCh, 1 x 10(-5) M) or nicotine (5 x 10(-6) M) increased the numbers of EPCs with long release latencies mainly in the distal region of the endplate (90-120 microm from the last node of Ranvier), where the synchronization of transmitter release was the most pronounced. The parameters of focally recorded motor nerve action potentials were not changed by either ACh or CCh. The effects of CCh and nicotine on quantal dispersion were reduced substantially by 5 x 10(-7) M (+)tubocurarine (TC). The muscarinic agonists, oxotremorine and the propargyl ester of arecaidine, as well as antagonists such as pirenzepine, AF-DX 116 and methoctramine, alone or in combination, did not affect the dispersion of the release. Muscarinic antagonists did not block the dispersion action of CCh. Cholinergic drugs either decreased the quantal content m(o) (muscarinic agonist, oxotremorine M, and nicotinic antagonist, TC), or decreased m(o) and dispersed the release (ACh, CCh and nicotine). The effects on m(o) were not related either to the endplate region or to the initial level of release dispersion. It follows that the mechanisms regulating the amount and the time course of transmitter release are different and that, among other factors, they are altered by presynaptic nicotinic receptors.
Figures
Similar articles
-
Muscarinic M1 acetylcholine receptors regulate the non-quantal release of acetylcholine in the rat neuromuscular junction via NO-dependent mechanism.J Neurochem. 2007 Sep;102(6):2110-2117. doi: 10.1111/j.1471-4159.2007.04696.x. Epub 2007 Jun 11. J Neurochem. 2007. PMID: 17561934
-
Muscarinic inhibition of quantal transmitter release from the magnesium-paralysed frog sartorius muscle.Neuroscience. 1989;30(3):827-36. doi: 10.1016/0306-4522(89)90174-7. Neuroscience. 1989. PMID: 2788830
-
The effect of carbachol and alpha-bungarotoxin on the frequency of miniature endplate potentials at the frog neuromuscular junction.Exp Physiol. 2000 Mar;85(2):125-31. Exp Physiol. 2000. PMID: 10751508
-
[Muscarinic modulation of cardiac activity].J Soc Biol. 1999;193(6):469-80. J Soc Biol. 1999. PMID: 10783705 Review. French.
-
The George B. Koelle symposium on the cholinergic synapse.Life Sci. 1992;50(15):PL91-9. doi: 10.1016/0024-3205(92)90351-o. Life Sci. 1992. PMID: 1313517 Review.
Cited by
-
Muscarinic Cholinoreceptors in Skeletal Muscle: Localization and Functional Role.Acta Naturae. 2023 Oct-Dec;15(4):44-55. doi: 10.32607/actanaturae.25259. Acta Naturae. 2023. PMID: 38234599 Free PMC article.
-
Participation of different types of voltage-dependent calcium channels in evoked quantal transmitter release in frog neuromuscular junctions.Dokl Biol Sci. 2008 Nov-Dec;423:389-91. doi: 10.1134/s0012496608060069. Dokl Biol Sci. 2008. PMID: 19213416 No abstract available.
-
Acetylcholine-Induced Inhibition of Presynaptic Calcium Signals and Transmitter Release in the Frog Neuromuscular Junction.Front Physiol. 2016 Dec 12;7:621. doi: 10.3389/fphys.2016.00621. eCollection 2016. Front Physiol. 2016. PMID: 28018246 Free PMC article.
-
From Frog Muscle to Brain Neurons: Joys and Sorrows in Neuroscience.Physiol Res. 2024 Aug 30;73(S1):S83-S103. doi: 10.33549/physiolres.935414. Epub 2024 Jul 2. Physiol Res. 2024. PMID: 38957950 Free PMC article. Review.
-
Presynaptic Acetylcholine Receptors Modulate the Time Course of Action Potential-Evoked Acetylcholine Quanta Secretion at Neuromuscular Junctions.Biomedicines. 2022 Jul 22;10(8):1771. doi: 10.3390/biomedicines10081771. Biomedicines. 2022. PMID: 35892671 Free PMC article. Review.
References
Publication types
MeSH terms
Substances
LinkOut - more resources
Full Text Sources