. 2004 Aug;24(15):6710-8.
doi: 10.1128/MCB.24.15.6710-6718.2004.

mTOR is essential for growth and proliferation in early mouse embryos and embryonic stem cells

Affiliations

mTOR is essential for growth and proliferation in early mouse embryos and embryonic stem cells

Mirei Murakami et al. Mol Cell Biol. 2004 Aug.

Abstract

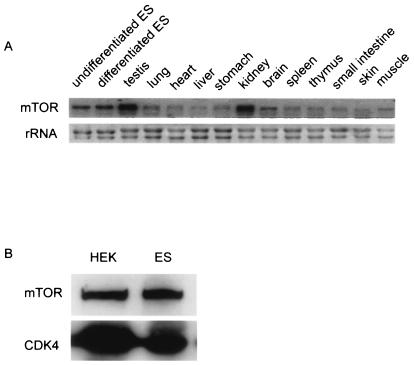
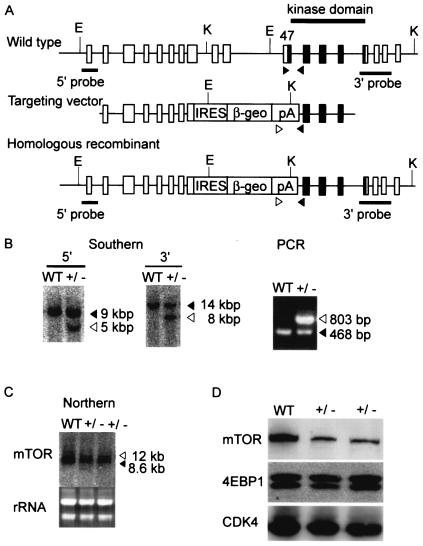
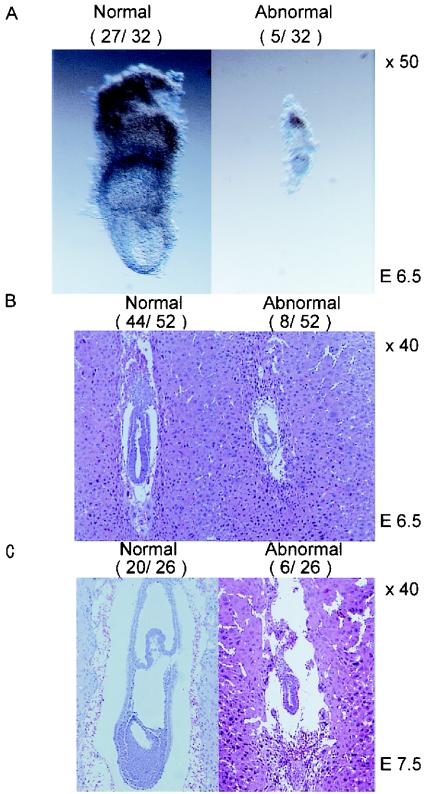
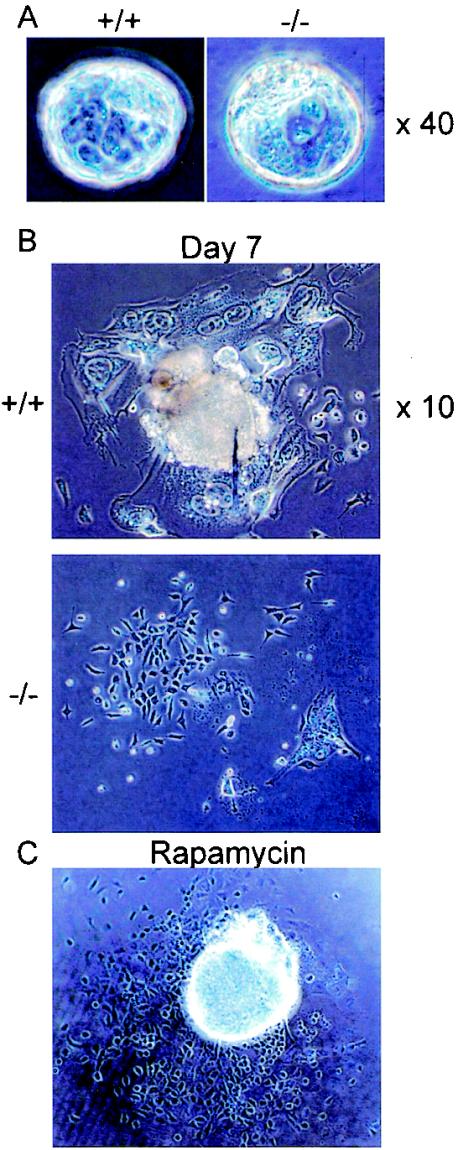
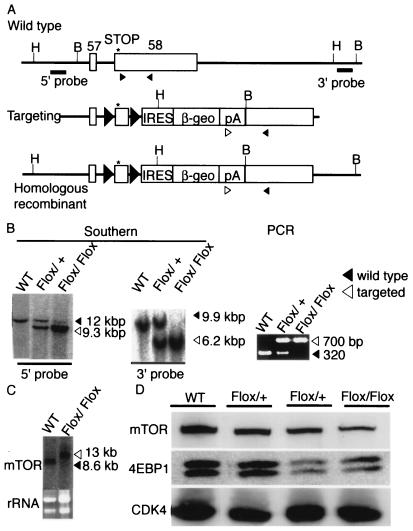
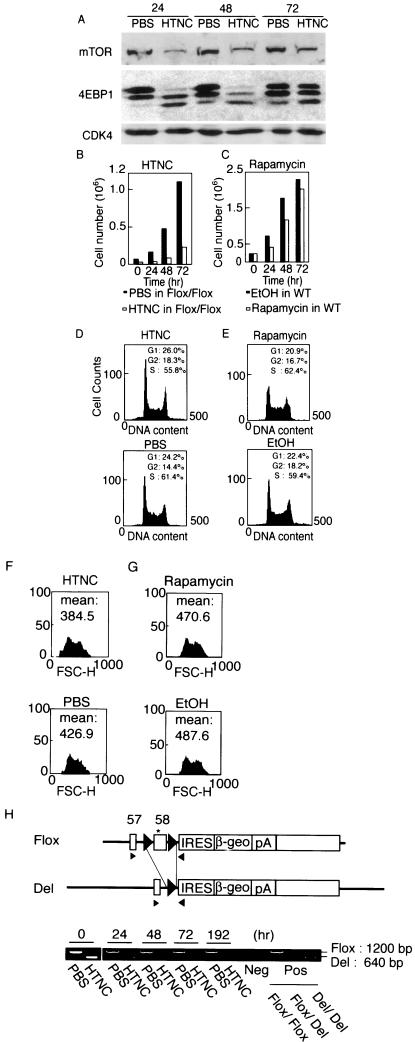
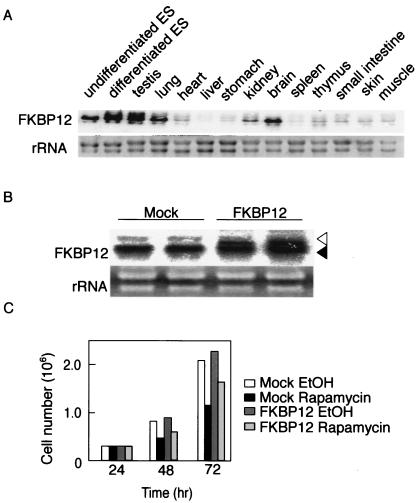
TOR is a serine-threonine kinase that was originally identified as a target of rapamycin in Saccharomyces cerevisiae and then found to be highly conserved among eukaryotes. In Drosophila melanogaster, inactivation of TOR or its substrate, S6 kinase, results in reduced cell size and embryonic lethality, indicating a critical role for the TOR pathway in cell growth control. However, the in vivo functions of mammalian TOR (mTOR) remain unclear. In this study, we disrupted the kinase domain of mouse mTOR by homologous recombination. While heterozygous mutant mice were normal and fertile, homozygous mutant embryos died shortly after implantation due to impaired cell proliferation in both embryonic and extraembryonic compartments. Homozygous blastocysts looked normal, but their inner cell mass and trophoblast failed to proliferate in vitro. Deletion of the C-terminal six amino acids of mTOR, which are essential for kinase activity, resulted in reduced cell size and proliferation arrest in embryonic stem cells. These data show that mTOR controls both cell size and proliferation in early mouse embryos and embryonic stem cells.


Figures

FIG. 1.
FIG. 1.
Expression profiles of mTOR. (A) Expression levels of mTOR transcripts in ES cells and in 12 adult mouse tissues were determined by Northern blot. (B) mTOR protein levels in human embryonic kidney (HEK) cells and ES cells were determined by Western blot analyses as previously described (16). CDK4 was used as a loading control.
FIG. 2.
FIG. 2.
Targeted disruption of the mouse mTOR gene. (A) We constructed a targeting vector that replaces exons 44 to 47 with an IRES-βgeo cassette. Shown are the locations of restriction enzyme sites (E, EcoRI; K, KpnI) and probes for Southern blot analyses. Exons corresponding to the kinase domain are shown by black boxes. Arrowheads indicate primers used for PCR. (B) Southern blot and PCR analyses. Solid arrows indicate bands corresponding to the wild-type locus, whereas open arrows indicate bands corresponding to the targeted locus. WT, wild type ES cells; +/−, heterozygous mutant ES cells. (C) Northern blot analysis showed that targeted cells expressed a larger transcript, corresponding to the fusion of mTOR and βgeo, in addition to the wild-type transcript. (D) Western blot analyses. The protein levels of mTOR, 4E-BP1, and CDK4 were determined as previously described (16).
FIG. 3.
FIG. 3.
Embryonic lethality of mTOR mutants. (A) Embryos dissected at 6.5 days postcoitum. (B and C) Hematoxylin- and eosin-stained sections of paraffin-embedded embryos at 6.5 days postcoitum (B) and 7.5 days postcoitum (C). Numbers of embryos with normal and mutant (abnormal) morphologies are shown in parentheses.
FIG. 4.
FIG. 4.
Roles of mTOR in blastocyst proliferation. (A) Embryos were collected from heterozygous intercrosses at 3.5 days postcoitum and genotyped by PCR. Representative wild-type (+/+) and homozygous mutant (−/−) embryos are shown. (B) Wild-type and homozygous mutant blastocysts were cultured on gelatin-coated dishes for 7 days. (C) Wild-type blastocysts were cultured in vitro for 7 days with rapamycin (200 nM).
FIG. 5.
FIG. 5.
Conditional deletion of the extreme C terminus of mTOR in ES cells. (A) The 3′ terminus of the mTOR gene, the targeting vector, and the correctly targeted mutant locus are shown. Solid triangles in the latter two sequences indicate loxP sites. Asterisks indicate translational termination codons of mTOR. The positions of restriction enzyme sites (B, BamH; H, HindIII) and probes for Southern blotting and the locations of PCR primers (arrowheads) are also shown. (B) Southern blot and PCR analyses. Solid arrowheads indicate bands corresponding to the wild-type locus, whereas open arrowheads indicate bands corresponding to the targeted locus. WT, wild-type ES cells; Flox/+, heterozygous targeted ES cells; Flox/Flox, homozygous targeted ES cells. (C) Northern blot analysis. (D) Western blot analyses showing the protein levels of mTOR, 4E-BP1, and CDK4.
FIG. 6.
FIG. 6.
Effect of mTOR inactivation in ES cells. (A) mTORFlox/Flox ES cells and wild-type ES cells were treated with a recombinant fusion protein consisting of a histidine tag, Tat peptide, simian virus 40 nuclear localization signal, and Cre recombinase (HTNC) or PBS. The proteins levels of mTOR, 4E-BP1, and CDK4 were determined by Western blot at 24, 48, and 72 h after HTNC treatment. (B) Cell numbers were counted every 24 h. (C) Wild-type ES cells were treated with rapamycin (20 nM) or solvent (ethanol) for the indicated time, and cell numbers were counted. (D and E) Cell cycle distribution was determined by flow cytometry analysis of the cells in panels B and C. (E and F) Cell size distribution (forward scatter, FSC-H) was determined by flow cytometry analysis of the cells in panels B and C. (H) Cre-mediated deletion of the floxed fragment was evaluated by PCR at the indicated time points after HTNC treatment. Arrowheads indicate primers used for PCR analyses. Del indicates the locus that underwent Cre-mediated deletion of the floxed region. The asterisk indicates the translation termination codon.
FIG. 7.
FIG. 7.
FKBP12 expression in ES cells. (A) Tissue distribution of FKBP12 transcripts was determined by Northern blot analysis. (B) Northern blot analysis confirming transgene expression of FKBP12 in MG1.19 ES cells. The open arrowhead indicates expression from the transgene, while the solid arrowhead indicates endogenous expression. As negative controls, cells were transfected with the parent plasmid (mock). (C) Effect of rapamycin (20 nM) on proliferation of cells transfected with the parent plasmid (mock) and the FKBP12-expressing plasmid.

References

    1. Barbet, N. C., U. Schneider, S. B. Helliwell, I. Stansfield, M. F. Tuite, and M. N. Hall. 1996. TOR controls translation initiation and early G1 progression in yeast. Mol. Biol. Cell 7:25-42. - PMC - PubMed
    1. Brown, E. J., M. W. Albers, T. B. Shin, K. Ichikawa, C. T. Keith, W. S. Lane, and S. L. Schreiber. 1994. A mammalian protein targeted by G1-arresting rapamycin-receptor complex. Nature 369:756-758. - PubMed
    1. Brown, E. J., P. A. Beal, C. T. Keith, J. Chen, T. B. Shin, and S. L. Schreiber. 1995. Control of p70 s6 kinase by kinase activity of FRAP in vivo. Nature 377:441-446. - PubMed
    1. Brunn, G. J., C. C. Hudson, A. Sekulic, J. M. Williams, H. Hosoi, P. J. Houghton, J. C. Lawrence, Jr., and R. T. Abraham. 1997. Phosphorylation of the translational repressor PHAS-I by the mammalian target of rapamycin. Science 277:99-101. - PubMed
    1. Burnett, P. E., R. K. Barrow, N. A. Cohen, S. H. Snyder, and D. M. Sabatini. 1998. RAFT1 phosphorylation of the translational regulators p70 S6 kinase and 4E-BP1. Proc. Natl. Acad. Sci. USA 95:1432-1437. - PMC - PubMed

Publication types

MeSH terms