. 2004 Aug;24(15):6728-41.
doi: 10.1128/MCB.24.15.6728-6741.2004.

In vivo mitochondrial p53 translocation triggers a rapid first wave of cell death in response to DNA damage that can precede p53 target gene activation

Affiliations

In vivo mitochondrial p53 translocation triggers a rapid first wave of cell death in response to DNA damage that can precede p53 target gene activation

Susan Erster et al. Mol Cell Biol. 2004 Aug.

Abstract

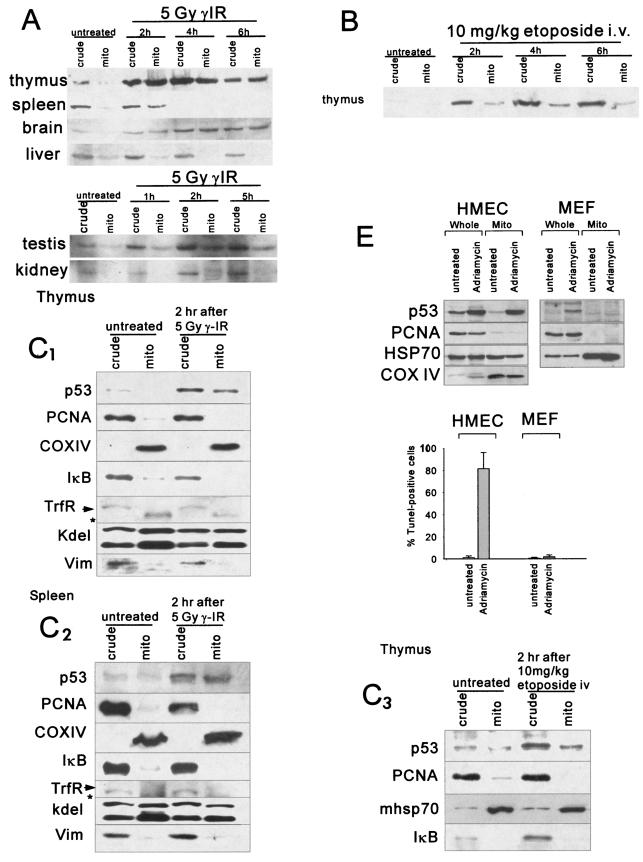
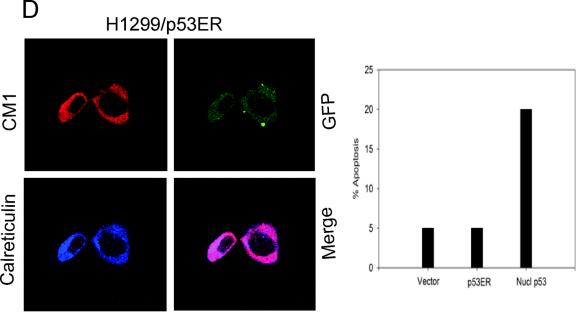
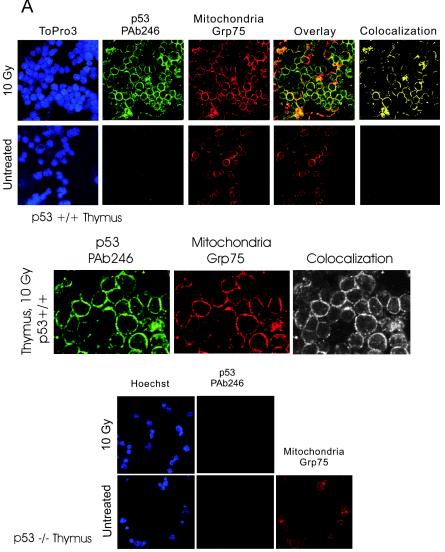
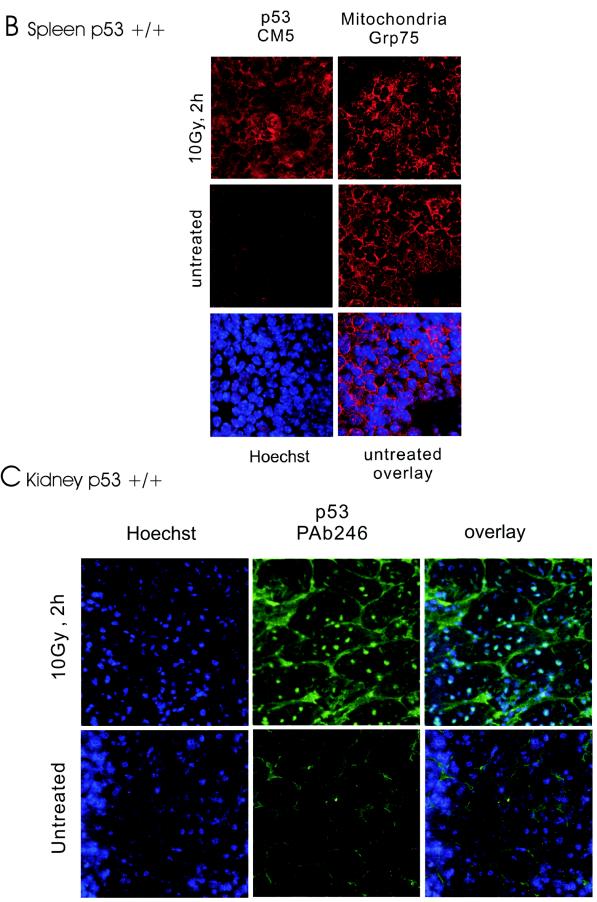
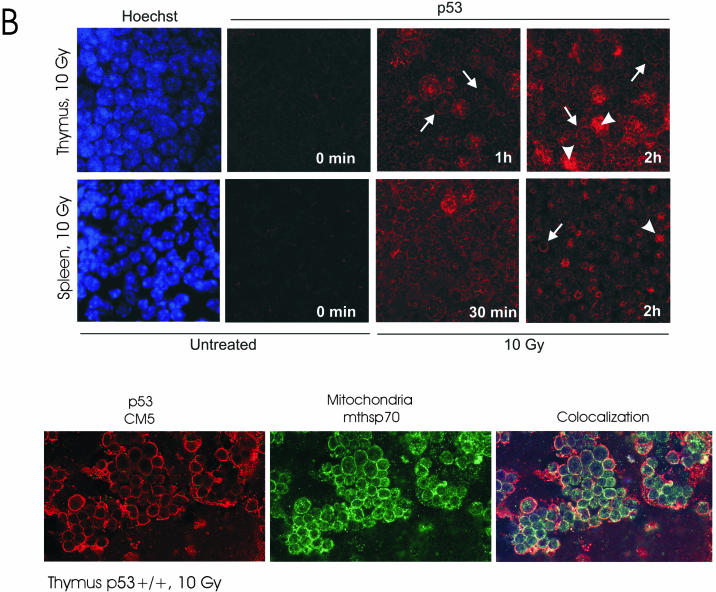
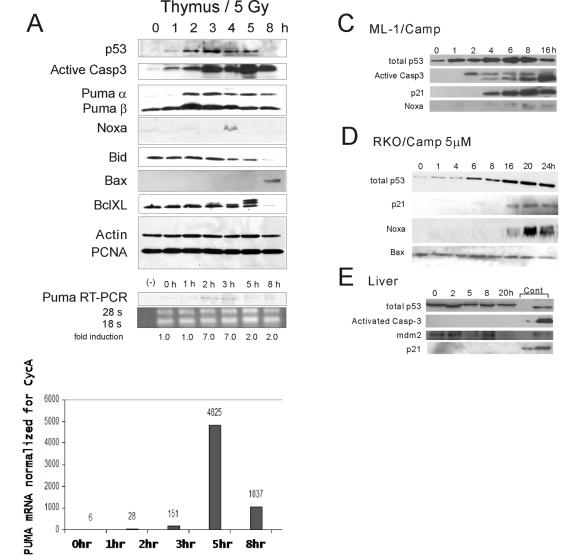
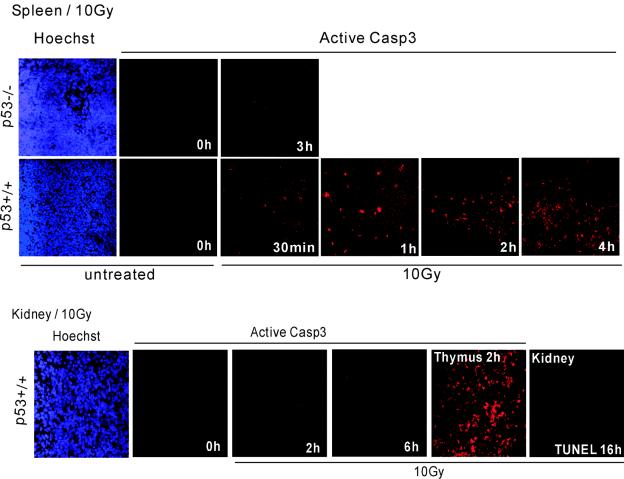
p53 promotes apoptosis in response to death stimuli by transactivation of target genes and by transcription-independent mechanisms. We recently showed that wild-type p53 rapidly translocates to mitochondria in response to multiple death stimuli in cultured cells. Mitochondrial p53 physically interacts with antiapoptotic Bcl proteins, induces Bak oligomerization, permeabilizes mitochondrial membranes, and rapidly induces cytochrome c release. Here we characterize the mitochondrial p53 response in vivo. Mice were subjected to gamma irradiation or intravenous etoposide administration, followed by cell fractionation and immunofluorescence studies of various organs. Mitochondrial p53 accumulation occurred in radiosensitive organs like thymus, spleen, testis, and brain but not in liver and kidney. Of note, mitochondrial p53 translocation was rapid (detectable at 30 min in thymus and spleen) and triggered an early wave of marked caspase 3 activation and apoptosis. This caspase 3-mediated apoptosis was entirely p53 dependent, as shown by p53 null mice, and preceded p53 target gene activation. The transcriptional p53 program had a longer lag phase than the rapid mitochondrial p53 program. In thymus, the earliest apoptotic target gene products PUMA, Noxa, and Bax appeared at 2, 4, and 8 h, respectively, while Bid, Killer/DR5, and p53DinP1 remained uninduced even after 20 h. Target gene induction then led to further increase in active caspase 3. Similar biphasic kinetics was seen in cultured human cells. Our results suggest that in sensitive organs mitochondrial p53 accumulation in vivo occurs soon after a death stimulus, triggering a rapid first wave of apoptosis that is transcription independent and may precede a second slower wave that is transcription dependent.


Figures

FIG. 1.
FIG. 1.
Rapid mitochondrial p53 accumulation in response to γIR in thymus, spleen, testis, and brain but not in liver and kidney. (A) Normal mice were subjected to 5-Gy whole-body γIR or left untreated. After the indicated time intervals, mitochondria (mito) were purified from various organs. Crude (whole-cell) lysates and mitochondrial fractions were characterized by immunoblotting with the anti-mouse p53 antibody CM5. Equal amounts (5 to 15 μg per lane) of total protein from crude lysates and mitochondrial fractions were loaded for each organ. (B) Mitochondrial p53 accumulation in response to etoposide. Normal mice were treated with 10 mg of etoposide/kg by tail vein injection or left untreated. Mitochondria and whole-cell lysates were prepared from thymi at the indicated times and analyzed as described above. Equal amounts (15 μg) of total protein per lane were loaded. (C) Mitochondrial fractions were free of nuclear and cytoplasmic contamination. Shown are results for thymi and spleens from untreated and treated (2 h after γIR or intravenous [i.v.] treatment with etoposide at 10 mg/kg) normal mice. The purity of mitochondrial fractions from organs was assessed by immunoblotting with antibodies against the nuclear and cytoplasmic marker proteins PCNA and IκB, the plasma membrane marker transferrin receptor (TrfR), the cytoskeletal marker vimentin (Vim), and the ER marker kdel. Mitochondrial enrichment was seen with mitochondrial markers COX IV (inner membrane bound) or mthsp70 (mitochondrial matrix). Equal amounts (5 μg) of total protein per lane were loaded, except in the case of vimentin (50 μg). Mitochondrial fractions from organs contained ER. (D, left panels) To exclude the possibility that p53, although not reported to localize to the ER, could launch apoptosis from the ER, p53 was deliberately targeted to the ER by fusion of its C terminus with the ER leader sequence of human cytochrome b5. This p53ER fusion protein, when transfected into p53 null H1299 cells, localized to the ER, as shown by colocalization with calreticulin. CM1, p53 antibody; GFP, green fluorescent protein. (D, right panel) However, p53ER was devoid of apoptotic ability in p53 null H1299 cells as well as in SaOS-2 cells (data not shown). Nucl p53, nuclear p53. (E) Mitochondrial p53 accumulation in HMEC. HMEC were left untreated or treated with doxorubicin (0.34 μM), which led to massive apoptosis within 24 h as determined by TUNEL. Mitochondria and whole-cell lysates were prepared from an aliquot after 6 h of exposure to doxorubicin. Equal amounts (5 μg) of total protein per lane were loaded. p53 did not translocate to mitochondria during p53-mediated cell cycle arrest in primary MEFs. MEFs were left untreated or treated with doxorubicin (0.34 μM), leading to cellular p53 accumulation and cell cycle arrest within 24 h (data not shown). Mitochondria and whole-cell lysates were prepared from an aliquot after 4 h. Immunoblots with equal amounts (5 μg) of total protein loaded per lane are shown as in panel C.
FIG. 1.
FIG. 1.
Rapid mitochondrial p53 accumulation in response to γIR in thymus, spleen, testis, and brain but not in liver and kidney. (A) Normal mice were subjected to 5-Gy whole-body γIR or left untreated. After the indicated time intervals, mitochondria (mito) were purified from various organs. Crude (whole-cell) lysates and mitochondrial fractions were characterized by immunoblotting with the anti-mouse p53 antibody CM5. Equal amounts (5 to 15 μg per lane) of total protein from crude lysates and mitochondrial fractions were loaded for each organ. (B) Mitochondrial p53 accumulation in response to etoposide. Normal mice were treated with 10 mg of etoposide/kg by tail vein injection or left untreated. Mitochondria and whole-cell lysates were prepared from thymi at the indicated times and analyzed as described above. Equal amounts (15 μg) of total protein per lane were loaded. (C) Mitochondrial fractions were free of nuclear and cytoplasmic contamination. Shown are results for thymi and spleens from untreated and treated (2 h after γIR or intravenous [i.v.] treatment with etoposide at 10 mg/kg) normal mice. The purity of mitochondrial fractions from organs was assessed by immunoblotting with antibodies against the nuclear and cytoplasmic marker proteins PCNA and IκB, the plasma membrane marker transferrin receptor (TrfR), the cytoskeletal marker vimentin (Vim), and the ER marker kdel. Mitochondrial enrichment was seen with mitochondrial markers COX IV (inner membrane bound) or mthsp70 (mitochondrial matrix). Equal amounts (5 μg) of total protein per lane were loaded, except in the case of vimentin (50 μg). Mitochondrial fractions from organs contained ER. (D, left panels) To exclude the possibility that p53, although not reported to localize to the ER, could launch apoptosis from the ER, p53 was deliberately targeted to the ER by fusion of its C terminus with the ER leader sequence of human cytochrome b5. This p53ER fusion protein, when transfected into p53 null H1299 cells, localized to the ER, as shown by colocalization with calreticulin. CM1, p53 antibody; GFP, green fluorescent protein. (D, right panel) However, p53ER was devoid of apoptotic ability in p53 null H1299 cells as well as in SaOS-2 cells (data not shown). Nucl p53, nuclear p53. (E) Mitochondrial p53 accumulation in HMEC. HMEC were left untreated or treated with doxorubicin (0.34 μM), which led to massive apoptosis within 24 h as determined by TUNEL. Mitochondria and whole-cell lysates were prepared from an aliquot after 6 h of exposure to doxorubicin. Equal amounts (5 μg) of total protein per lane were loaded. p53 did not translocate to mitochondria during p53-mediated cell cycle arrest in primary MEFs. MEFs were left untreated or treated with doxorubicin (0.34 μM), leading to cellular p53 accumulation and cell cycle arrest within 24 h (data not shown). Mitochondria and whole-cell lysates were prepared from an aliquot after 4 h. Immunoblots with equal amounts (5 μg) of total protein loaded per lane are shown as in panel C.
FIG. 2.
FIG. 2.
Detection of stress-induced mitochondrial p53 accumulation in vivo by confocal immunofluorescence. (A, top panels) Colocalization of p53 and mitochondrial marker protein Grp75 (mthsp70) in irradiated thymus. Normal mice were subjected to 10-Gy γIR (top row) or left untreated (bottom row). After 2 h, tissue smears were prepared from thymi and double-stained with monoclonal anti-p53 antibody PAb 246 followed by FITC-goat anti-mouse antibody and a rabbit anti-Grp75 antibody followed by TRITC-donkey anti-rabbit antibody. Untreated cells exhibited no detectable staining with PAb 246. In contrast, all irradiated thymocytes exhibited prominent, finely punctated perinuclear ring staining, which exceeded the concomitant faint nuclear staining at this time point. Cytoplasmic p53 largely colocalized with mitochondria (yellow only). Nuclei were counterstained with Hoechst or ToPro3. (A, middle panels) Magnified region from Fig. 2A, top panels, for visualization of punctate staining. (A, bottom panels) Specificity of the p53 antibody. p53−/− mice were treated or left untreated, and thymocytes were stained with PAb 246 followed by FITC-goat anti-mouse antibody. No signal was detectable with the p53 antibody. Images in all figures were captured by a Zeiss confocal microscope model 510 SM at identical acquisition and image processing parameters. (B) Mitochondrial p53 accumulation in irradiated spleen. Normal mice were subjected to 10-Gy γIR or left untreated. After 2 h, spleens were removed and touch preparation slides were made and stained with polyclonal anti-p53 CM5 or anti-Grp75 antibodies, followed by TRITC-donkey anti-rabbit antibody. In untreated spleen, CM5 gave minimal background staining. In contrast, treated spleen showed finely punctate, perinuclear p53 accumulation similar to the Grp75 pattern and consistent with mitochondrial localization. Weak nuclear p53 staining was discerned as well. Nuclei of untreated cells were counterstained with Hoechst and overlaid with Grp75 to emphasize the mitochondrial pattern. (C) Nuclear p53 in irradiated kidney. Mice were subjected to 10-Gy γIR or left untreated. After 2 h, kidneys were removed and frozen sections were stained with anti-p53 antibody PAb 246, followed by FITC-goat anti-mouse antibody. Nuclei were counterstained with Hoechst. The p53 antibody shows nonspecific tubular basement membrane staining in untreated and treated cells (large green rings). In treated cells, only nuclear p53 accumulation was detectable.
FIG. 2.
FIG. 2.
Detection of stress-induced mitochondrial p53 accumulation in vivo by confocal immunofluorescence. (A, top panels) Colocalization of p53 and mitochondrial marker protein Grp75 (mthsp70) in irradiated thymus. Normal mice were subjected to 10-Gy γIR (top row) or left untreated (bottom row). After 2 h, tissue smears were prepared from thymi and double-stained with monoclonal anti-p53 antibody PAb 246 followed by FITC-goat anti-mouse antibody and a rabbit anti-Grp75 antibody followed by TRITC-donkey anti-rabbit antibody. Untreated cells exhibited no detectable staining with PAb 246. In contrast, all irradiated thymocytes exhibited prominent, finely punctated perinuclear ring staining, which exceeded the concomitant faint nuclear staining at this time point. Cytoplasmic p53 largely colocalized with mitochondria (yellow only). Nuclei were counterstained with Hoechst or ToPro3. (A, middle panels) Magnified region from Fig. 2A, top panels, for visualization of punctate staining. (A, bottom panels) Specificity of the p53 antibody. p53−/− mice were treated or left untreated, and thymocytes were stained with PAb 246 followed by FITC-goat anti-mouse antibody. No signal was detectable with the p53 antibody. Images in all figures were captured by a Zeiss confocal microscope model 510 SM at identical acquisition and image processing parameters. (B) Mitochondrial p53 accumulation in irradiated spleen. Normal mice were subjected to 10-Gy γIR or left untreated. After 2 h, spleens were removed and touch preparation slides were made and stained with polyclonal anti-p53 CM5 or anti-Grp75 antibodies, followed by TRITC-donkey anti-rabbit antibody. In untreated spleen, CM5 gave minimal background staining. In contrast, treated spleen showed finely punctate, perinuclear p53 accumulation similar to the Grp75 pattern and consistent with mitochondrial localization. Weak nuclear p53 staining was discerned as well. Nuclei of untreated cells were counterstained with Hoechst and overlaid with Grp75 to emphasize the mitochondrial pattern. (C) Nuclear p53 in irradiated kidney. Mice were subjected to 10-Gy γIR or left untreated. After 2 h, kidneys were removed and frozen sections were stained with anti-p53 antibody PAb 246, followed by FITC-goat anti-mouse antibody. Nuclei were counterstained with Hoechst. The p53 antibody shows nonspecific tubular basement membrane staining in untreated and treated cells (large green rings). In treated cells, only nuclear p53 accumulation was detectable.
FIG. 3.
FIG. 3.
Mitochondrial translocation of p53 was detectable as early as 30 min after γIR in thymus and spleen. (A) Mice were subjected to 5-Gy γIR or left untreated. After the indicated times, spleens and thymi were removed for kinetic studies. Mitochondria (mito) were isolated by fractionation and immunoblotted for p53 (with CM5) and purity markers as described in the legend to Fig. 1C. p53 started to accumulate at mitochondria as early as 30 min after stress in both organs. (B, top panels) Likewise, mitochondrial p53 accumulation was detected by immunofluorescence at 30 and 60 min postirradiation in spleen and thymus, respectively, as indicated by predominantly perinuclear punctate p53 staining (example cells are indicated by arrows). In contrast, marked nuclear p53 accumulation became increasingly prominent starting at 2 h postirradiation (examples are indicated by arrowheads). (B, bottom panels) Tissue smears were prepared from thymus 1 h after 10-Gy irradiation in vivo and double-stained with polyclonal anti-p53 antibody CM5 (in red) and monoclonal anti-mthsp70 (in green). (C) Human RKO cells (colorectal carcinoma cells expressing wild-type p53) were treated with a low dose (5 μM) of camptothecin for 0 to 4 h prior to mitochondrial isolation. Immunoblots of crude and mitochondrial lysates (5 μg of total protein per lane) for p53 (DO1) and the indicated markers are shown. As in thymus and spleen in mouse, mitochondrial p53 accumulation started to be detectable at 30 min poststress.
FIG. 3.
FIG. 3.
Mitochondrial translocation of p53 was detectable as early as 30 min after γIR in thymus and spleen. (A) Mice were subjected to 5-Gy γIR or left untreated. After the indicated times, spleens and thymi were removed for kinetic studies. Mitochondria (mito) were isolated by fractionation and immunoblotted for p53 (with CM5) and purity markers as described in the legend to Fig. 1C. p53 started to accumulate at mitochondria as early as 30 min after stress in both organs. (B, top panels) Likewise, mitochondrial p53 accumulation was detected by immunofluorescence at 30 and 60 min postirradiation in spleen and thymus, respectively, as indicated by predominantly perinuclear punctate p53 staining (example cells are indicated by arrows). In contrast, marked nuclear p53 accumulation became increasingly prominent starting at 2 h postirradiation (examples are indicated by arrowheads). (B, bottom panels) Tissue smears were prepared from thymus 1 h after 10-Gy irradiation in vivo and double-stained with polyclonal anti-p53 antibody CM5 (in red) and monoclonal anti-mthsp70 (in green). (C) Human RKO cells (colorectal carcinoma cells expressing wild-type p53) were treated with a low dose (5 μM) of camptothecin for 0 to 4 h prior to mitochondrial isolation. Immunoblots of crude and mitochondrial lysates (5 μg of total protein per lane) for p53 (DO1) and the indicated markers are shown. As in thymus and spleen in mouse, mitochondrial p53 accumulation started to be detectable at 30 min poststress.
FIG. 4.
FIG. 4.
Stress-induced mitochondrial p53 accumulation coincided with a burst of early caspase 3 activation and cell death that preceded the production of apoptotic p53 target gene products in vivo. (A) Mice were subjected to 5-Gy γIR or left untreated. At 0, 1, 2, 3, 4, 5, 8, and 20 h, thymi were harvested. (A, top panels) Whole-cell homogenates were immediately prepared and immunoblotted with antibodies against p53 (UM1), activated caspase 3 (Active Casp3), PUMA α and β, Noxa, Bid, DR5/Killer, p53DINP1, Bax, and Bclxl. The latter are apoptotic target gene products that are induced by p53, except Bclxl, which is transrepressed by p53 (44). Actin and PCNA were used to adjust for loading of equal amounts of protein. Total cellular p53 stabilization started at 1 h. Cleaved caspase 3 was already generated by 1 h, and levels increased at 2 and 3 h and reached their peak at 5 h. In contrast, PUMA α and β protein induction began at 2 h while Noxa was only faintly and transiently detectable at 4 h. Bax was induced very late at 8 h. Bid, Killer/DR5, and p53DINP1 (data not shown) remained uninduced throughout. (A, bottom panels) Semiquantitative RT-PCR of PUMA transcripts from thymi treated or left untreated as described above. PUMA α and β induction also began at 2 h. Real-time RT-PCR confirmed this result. (B) Early caspase 3 activation and cell death after γIR in vivo. p53+/+ mice and p53−/− mice were subjected to 5-Gy (thymus) or 10-Gy (spleen and kidney) γIR or left untreated. At the indicated times, organs were harvested and snap-frozen sections were immunostained with an antibody that specifically recognizes the 17- to 19-kDa fragment of cleaved caspase 3 (the same antibody mentioned in the legend to Fig. 4A), followed by TRITC-donkey anti-rabbit antibody. Serial sections were also stained for TUNEL. Caspase 3 activation and cell death in thymus and spleen were strictly p53 dependent. Figure S1 (see the supplementary material available at http://www.path.sunysb.edu/faculty/umoll/default.htm) shows the same result in thymus after a dose of 10 Gy. On the other hand, kidney undergoes a strict p53-dependent arrest response (22). Thymus at 2 h serves here as the positive control for caspase 3 staining. Nuclei of the untreated (0 h) sections were counterstained with Hoechst. (C and D) Kinetic relationships between p53 mitochondrial translocation and target gene activation in human tumor cells. Wild-type p53-harboring ML-1 (C) and RKO (D) cells were treated with 5 μM camptothecin (Camp). At the indicated times, whole-cell lysates were prepared and immunoblotted. Active caspase 3 (Casp 3) appears as a 19- and 17-kDa doublet in ML-1 cells and as a 17-kDa protein in mouse tissues. Equal amounts of total protein per lane were loaded in the immunoblots shown in panels C and D. (E) Mice were subjected to 5-Gy γIR or left untreated. At 0, 2, 5, 8, and 20 h, livers were harvested and whole-cell homogenates were prepared and immunoblotted with antibodies against p53 (UM1), activated caspase 3, p21WAF1, and mdm2. With this treatment, the liver shows essentially no p53 induction and lacks any trace of an apoptotic or arrest response (22). Cont, doxorubicin-treated MEFs were used as positive controls.
FIG. 4.
FIG. 4.
Stress-induced mitochondrial p53 accumulation coincided with a burst of early caspase 3 activation and cell death that preceded the production of apoptotic p53 target gene products in vivo. (A) Mice were subjected to 5-Gy γIR or left untreated. At 0, 1, 2, 3, 4, 5, 8, and 20 h, thymi were harvested. (A, top panels) Whole-cell homogenates were immediately prepared and immunoblotted with antibodies against p53 (UM1), activated caspase 3 (Active Casp3), PUMA α and β, Noxa, Bid, DR5/Killer, p53DINP1, Bax, and Bclxl. The latter are apoptotic target gene products that are induced by p53, except Bclxl, which is transrepressed by p53 (44). Actin and PCNA were used to adjust for loading of equal amounts of protein. Total cellular p53 stabilization started at 1 h. Cleaved caspase 3 was already generated by 1 h, and levels increased at 2 and 3 h and reached their peak at 5 h. In contrast, PUMA α and β protein induction began at 2 h while Noxa was only faintly and transiently detectable at 4 h. Bax was induced very late at 8 h. Bid, Killer/DR5, and p53DINP1 (data not shown) remained uninduced throughout. (A, bottom panels) Semiquantitative RT-PCR of PUMA transcripts from thymi treated or left untreated as described above. PUMA α and β induction also began at 2 h. Real-time RT-PCR confirmed this result. (B) Early caspase 3 activation and cell death after γIR in vivo. p53+/+ mice and p53−/− mice were subjected to 5-Gy (thymus) or 10-Gy (spleen and kidney) γIR or left untreated. At the indicated times, organs were harvested and snap-frozen sections were immunostained with an antibody that specifically recognizes the 17- to 19-kDa fragment of cleaved caspase 3 (the same antibody mentioned in the legend to Fig. 4A), followed by TRITC-donkey anti-rabbit antibody. Serial sections were also stained for TUNEL. Caspase 3 activation and cell death in thymus and spleen were strictly p53 dependent. Figure S1 (see the supplementary material available at http://www.path.sunysb.edu/faculty/umoll/default.htm) shows the same result in thymus after a dose of 10 Gy. On the other hand, kidney undergoes a strict p53-dependent arrest response (22). Thymus at 2 h serves here as the positive control for caspase 3 staining. Nuclei of the untreated (0 h) sections were counterstained with Hoechst. (C and D) Kinetic relationships between p53 mitochondrial translocation and target gene activation in human tumor cells. Wild-type p53-harboring ML-1 (C) and RKO (D) cells were treated with 5 μM camptothecin (Camp). At the indicated times, whole-cell lysates were prepared and immunoblotted. Active caspase 3 (Casp 3) appears as a 19- and 17-kDa doublet in ML-1 cells and as a 17-kDa protein in mouse tissues. Equal amounts of total protein per lane were loaded in the immunoblots shown in panels C and D. (E) Mice were subjected to 5-Gy γIR or left untreated. At 0, 2, 5, 8, and 20 h, livers were harvested and whole-cell homogenates were prepared and immunoblotted with antibodies against p53 (UM1), activated caspase 3, p21WAF1, and mdm2. With this treatment, the liver shows essentially no p53 induction and lacks any trace of an apoptotic or arrest response (22). Cont, doxorubicin-treated MEFs were used as positive controls.

Similar articles

Cited by

References

    1. Attardi, L. D., E. E. Reczek, C. Cosmas, E. G. Demicco, M. E. McCurrach, S. W. Lowe, and T. Jacks. 2000. PERP, an apoptosis-associated target of p53, is a novel member of the PMP-22/gas3 family. Genes Dev. 14:704-718. - PMC - PubMed
    1. Baptiste, N., P. Friedlander, X. Chen, and C. Prives. 2002. The proline-rich domain of p53 is required for cooperation with anti-neoplastic agents to promote apoptosis of tumor cells. Oncogene 21:9-21. - PubMed
    1. Bennett, M., K. Macdonald, S. W. Chan, J. P. Luzio, R. Simari, and P. Weissberg. 1998. Cell surface trafficking of Fas: a rapid mechanism of p53-mediated apoptosis. Science 282:290-293. - PubMed
    1. Caelles, C., A. Helmberg, and M. Karin. 1994. p53-dependent apoptosis in the absence of transcriptional activation of p53-target genes. Nature 370:220-223. - PubMed
    1. Chao, C., S. Saito, J. Kang, C. W. Anderson, E. Appella, and Y. Xu. 2000. p53 transcriptional activity is essential for p53-dependent apoptosis following DNA damage. EMBO J. 19:4967-4975. - PMC - PubMed

Publication types

MeSH terms