. 2004 Oct;15(10):4695-709.
doi: 10.1091/mbc.e04-03-0171. Epub 2004 Jul 14.

NrCAM coupling to the cytoskeleton depends on multiple protein domains and partitioning into lipid rafts

Affiliations

NrCAM coupling to the cytoskeleton depends on multiple protein domains and partitioning into lipid rafts

Julien Falk et al. Mol Biol Cell. 2004 Oct.

Abstract

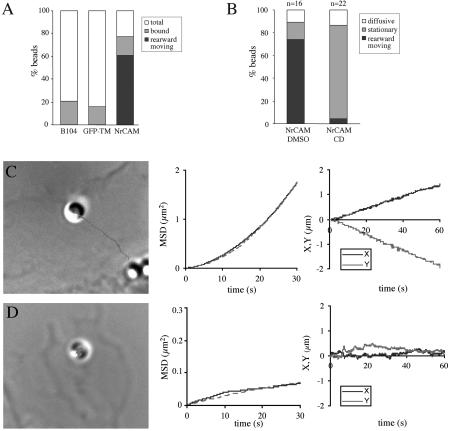
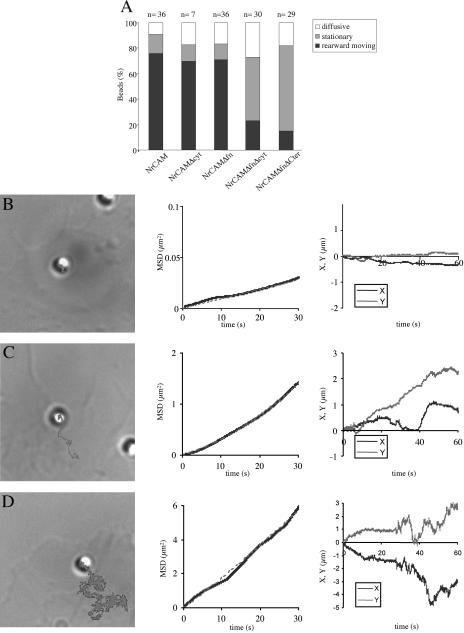
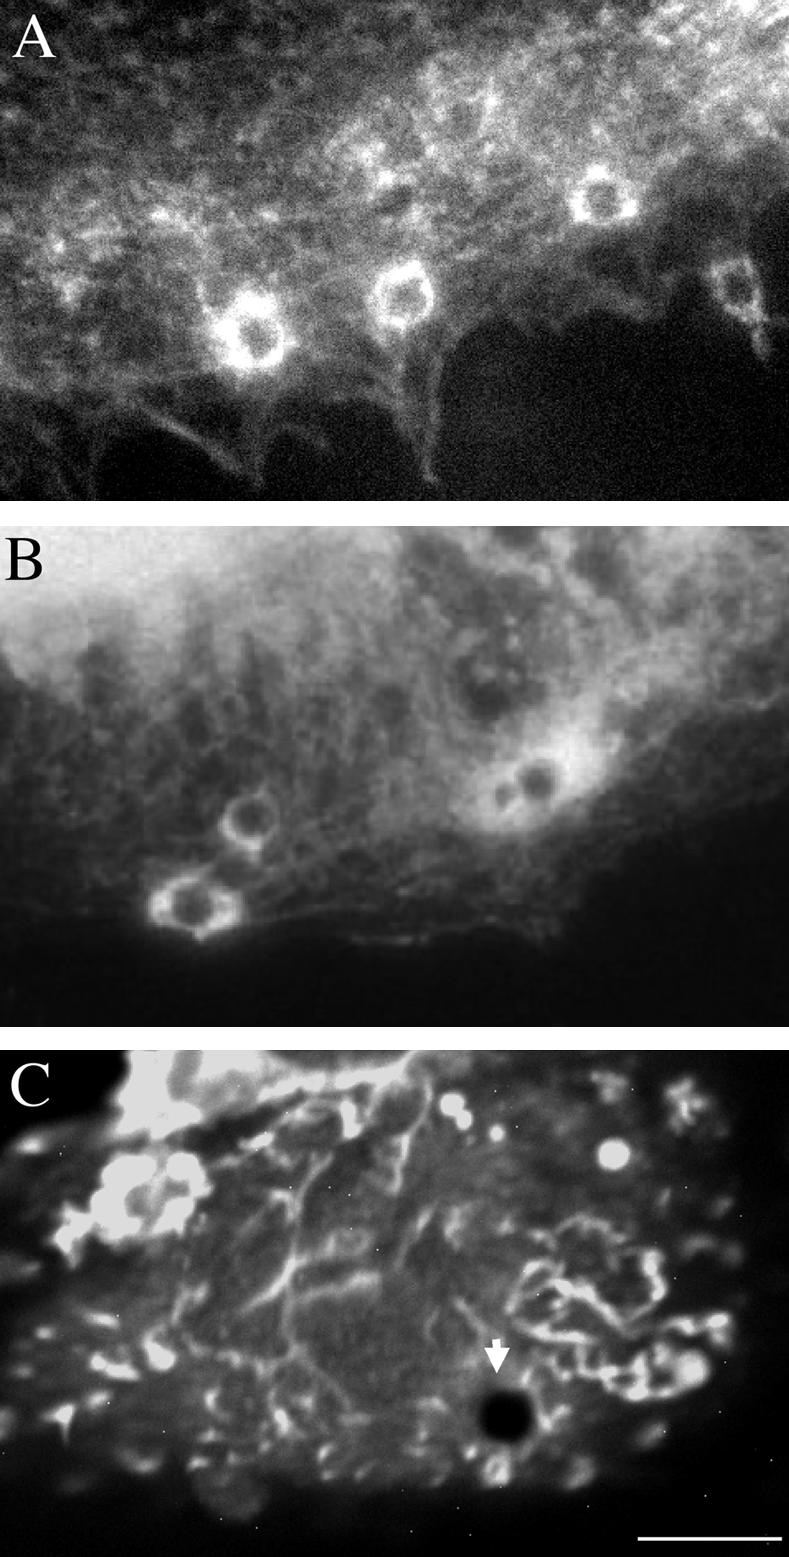
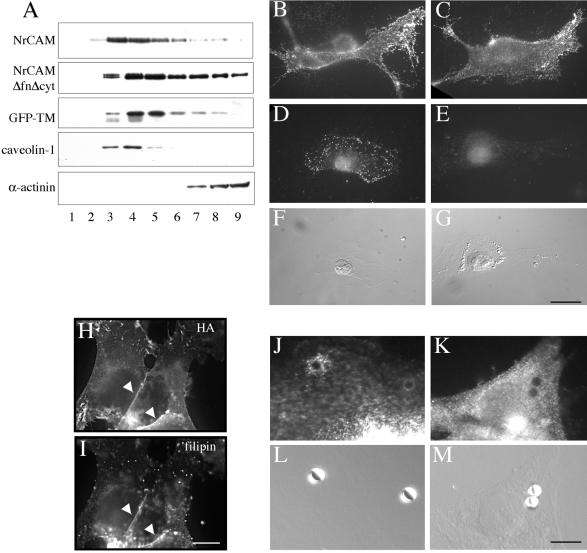
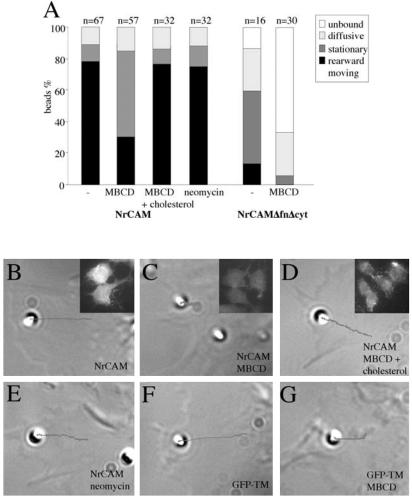
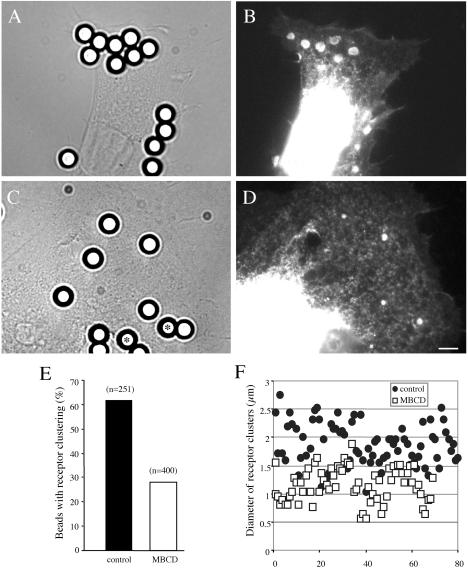
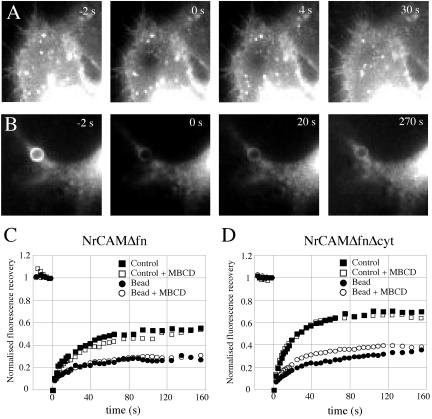
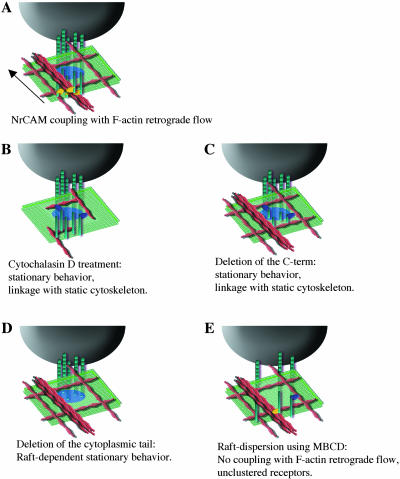
NrCAM is a cell adhesion molecule of the L1 family that is implicated in the control of axonal growth. Adhesive contacts may promote advance of the growth cone by triggering the coupling of membrane receptors with the F-actin retrograde flow. We sought to understand the mechanisms leading to clutching the F-actin at the site of ligand-mediated clustering of NrCAM. Using optical tweezers and single particle tracking of beads coated with the ligand TAG-1, we analyzed the mobility of NrCAM-deletion mutants transfected in a neuroblastoma cell line. Deletion of the cytoplasmic tail did not prevent the coupling of NrCAM to the actin flow. An additional deletion of the FNIII domains to remove cis-interactions, was necessary to abolish the rearward movement of TAG-1 beads, which instead switched to a stationary behavior. Next, we showed that the actin-dependent retrograde movement of NrCAM required partitioning into lipid rafts as indicated by cholesterol depletion experiments using methyl-beta-cyclodextrin. Recruitment of the raft component caveolin-1 was induced at the adhesive contact between the cell surface and TAG-1 beads, indicating that enlarged rafts were generated. Photobleaching experiments showed that the lateral mobility of NrCAM increased with raft dispersion in these contact areas, further suggesting that TAG-1-coated beads induced the coalescence of lipid rafts. In conclusion, we propose that anchoring of NrCAM with the retrograde actin flow can be triggered by adhesive contacts via cooperative processes including interactions with the cytoplasmic tail, formation of cis-complex via the FNIII repeats, and lipid raft aggregation.


Figures

Figure 1.
Figure 1.
Expression of full-length NrCAM and deleted constructs in neuroblastoma B104 cells. (A) Schematic representation of the different NrCAM expression constructs. All constructs were tagged with a HA epitope inserted 5 aa downstream of the signal peptide. NrCAMΔcyt is deleted from the cytoplasmic region. NrCAMΔfn is deleted from the 4 FNIII repeats that are replaced by GFP, NrCAMΔfnΔcyt displays an additional deletion of the cytoplasmic tail and NrCAMΔfnΔCter of the C-terminal region of the cytoplasmic tail. GFP-TM contains the signal peptide of NrCAM upstream and the transmembrane region of NrCAM downstream of GFP. Motifs of interaction with the cytoskeleton are indicated including a juxta-membrane domain (RNKG-GKYPVKE) corresponding to a consensus sequence for the binding of FERM adaptors, the FIGQY ankyrin-binding motif, and a SFV C-terminal PDZ-domain binding motif. (B) Expression of NrCAM and deleted constructs in stably transfected B104 cell lines. Cells were lysed with Triton X-100 and analyzed by SDS-PAGE and Western blotting with anti-NrCAM (lanes 1 and 2) or anti-HA antibodies (lanes 3–8). NrCAM is not detected in the lysate from parental B104 cells (lane 1) and is detected at 130 kDa in the NrCAM-expressing line (lanes 2 and 3). NrCAMΔcyt (lane 4), NrCAMΔfn (lane 5), NrCAMΔfnΔcyt (lane 6), and NrCAMΔfnΔCter (lane 7) are detected with an apparent Mr higher than the calculated molecular mass of 115, 112, 99, and 103, respectively, likely due to glycosylation. GFP-TM (lane 8) is detected at 31 kDa. Molecular weight markers are indicated on the right in kDa. Wb, Western blotting. (C and D) TAG-1 bead binding on NrCAM-expressing (C) or parental (D) B104 cells. Cells were incubated for 30 min with TAG-1 beads and fixed with 4% paraformaldehyde. (E) Quantitative analysis of TAG-1 and F3Fc bead binding on parental and NrCAM-expressing B104 cell lines. (F–H) B104 cells expressing the NrCAMΔfn construct tagged with GFP were incubated with soluble TAG-1IgFc chimera clustered with anti-Fc antibodies for 30 min. Binding sites for the TAG-1 chimera (F, red) were colocalized with the GFP fluorescence of NrCAMΔfn expressed at the cell membrane (G, green). Overlay image in H. Bars: 20 μm in C and D; 10 μm in F–H.
Figure 2.
Figure 2.
Actin-dependent retrograde mobility of TAG-1 beads on NrCAM-expressing B104 cells analyzed by single particle tracking. (A) Quantitative analysis of TAG-1 beads binding and rearward movement on parental, GFP-TM-, or NrCAM-expressing B104 cells. (B) TAG-1 bead mobility analyzed by time-lapse recording on NrCAM-expressing cells treated for 15 min with DMSO or 2 μM cytochalasin D (CD). (C) Representative trajectory of a TAG-1 bead placed onto NrCAM-expressing B104 cell with optical tweezers. The bead is shown at its original position, at the periphery of the lamellipodium. The trajectory was calculated from the timelapse recording during a 60-s period. The mean squared displacement (MSD) plotted as a function of time interval (plain line) follows a parabolic curve (dashed line) characteristic of a unidirectional diffusion mode as indicated by the directional velocity V = 2.5 μm/min and diffusion coefficient D = 1.3 10-3 μm2 s-1. Plots of X and Y coordinates vs. time show a uniform bead movement away from the leading edge. (D) NrCAM-expressing cell treated with 2 μM cytochalasin D for 15 min before time-lapse recording. The bead showed a stationary behavior. V = 0.3 μm/min and D = 0.3 10-3 μm2 s-1 were calculated from the MSD curve (note that the Y-axis scale of the MSD curve differs from C). X and Y coordinates showed very slight variations vs. time.
Figure 3.
Figure 3.
Behavior of TAG-1 beads on B104 cells expressing NrCAM-deleted constructs analyzed by single particle tracking and laser trapping experiments. (A) Quantitative analysis of TAG-1 bead mobility on B104 cells expressing NrCAM, NrCAMΔcyt, NrCAMΔfn, NrCAMΔfnΔcyt, and NrCAMΔfnΔCter. Bead movements were classified as “stationary” when displacement did not exceed 1 μm/min, otherwise as “diffusing” or “rearward moving.” (B–D) Panels exemplifying the three types of TAG-1 bead behaviors on NrCAMΔfnΔcyt-expressing cells: stationary (B), rearward moving (C), and diffusive (D). The beads are shown at the initial attachment site, and the trajectory was deduced from the time-lapse recording during a 60-s period. MSD plotted as a function of time interval (plain line). Plots of X and Y coordinates vs. time. Note that Y-axis scales differ in B, C, and D. (B) Most TAG-1 beads exhibited a stationary behavior. Analysis of a representative trajectory showed a slow directional velocity V = 0.3 μm/min and a diffusion coefficient D = 0.8 10-3 μm2 s-1. (C) A low percentage of TAG-1 beads displayed a directed movement as indicated by the MSD plots vs. time (plain line), which followed a parabolic curve (dashed line). However, the trajectory was irregular as shown in the curves of X and Y coordinates vs. time (compare with Figure 2C for full-length NrCAM). (D) Some of the TAG-1 beads were mostly diffusive, as on this example with chaotic X and Y displacements vs. time. The MSD curve vs. time is in blue, and the red line reflect the best fit of this curve by linear regression and gives an average diffusion coefficient D = 1.3 ± 2.7 10-2 μm2 s-1 (n = 14).
Figure 4.
Figure 4.
TAG-1 bead-mediated clustering of NrCAM induced the recruitment of F-actin and α-actinin at the bead-cell contact. NrCAM-expressing cells were incubated for 30 min with 4-μm TAG-1 beads. Cells were fixed with paraformaldehyde, permeabilized with Triton X-100 and processed for staining with Texas red–conjugated phalloidin (A) or immunofluorescence staining with anti-α-actinin (B) or anti-ezrin (C) antibodies. Actin filaments and α-actinin were heavily recruited at the contact site with TAG-1 beads. In contrast, ezrin did not appear to be concentrated at the TAG-1 bead contact (arrow). Bar, 12 μm.
Figure 5.
Figure 5.
NrCAM partitioning with lipid rafts. (A) B104 cells expressing NrCAM, NrCAMΔfnΔcyt, or GFP-TM were lysed with 1% Lubrol and subjected to sucrose equilibrium gradients. The different fractions (numbered from top to bottom) were collected and analyzed by SDS-PAGE and Western blotting. Immunoblotting for caveolin-1 indicates that the low-density fractions 3–5 contained lipid rafts. In contrast, α-actinin was only detected in high-density fractions. NrCAM, NrCAMΔfnΔcyt, and GFP-TM were recovered in low-density fractions as analyzed by immunoblot with anti-HA mAb. (B–G) Triton X-100 extraction of NrCAMΔfnΔcyt in living cells is induced by treatment with MBCD. Live NrCAMΔfnΔcyt-expressing cells were immunostained with anti-GFP antibodies without (B) or with 0.1% Triton X-100 incubation for 3 min (D) before fixation with paraformaldehyde. A treatment with 10 mM MBCD for 30 min to deplete membrane cholesterol had no effect on NrCAM immunostaining (C), whereas it strongly reduced immunofluorescence for NrCAM after Triton X-100 extraction in living cells (E). (F and G) Nomarski images corresponding to D and E, respectively, showed that Triton X-100 extraction and MBCD treatment did not alter the flat cell morphology. Bar, 20 μm. (H and I) NrCAM-expressing cells were fixed with paraformaldehyde, permeabilized with Triton X-100, and immunostained with anti-HA antibodies (H) and incubated with 50 μg/ml filipin to fluorescently label the cholesterol (I). Note that filipin was colocalized with NrCAM enriched at the cell junctions (arrowheads). Bar, 20 μm. (J–M) NrCAMΔfnΔcyt-expressing cells were incubated for 30 min with 4 μm-beads coupled with TAG-1IgFc. Cells were fixed with paraformaldehyde, permeabilized with Triton X-100, and processed for immunofluorescence staining with anti-caveolin-1 antibody. A punctate staining for caveolin-1 was detected at the contact with TAG-1 bead (J and L). In control experiments, GFP-TM–expressing cells were incubated with TAG-1 beads. Caveolin-1 was not recruited at the contact with such nonspecifically bound TAG-1 beads (K and M). Bar, 10 μm.
Figure 6.
Figure 6.
Raft dispersion using MBCD altered TAG-1 bead binding and mobility. (A) Single particle tracking analysis of TAG-1 bead mobility. Cells were incubated with 10 mM MBCD or with 10 mM MBCD saturated with cholesterol for 15 min before positioning beads with the laser trap. In NrCAM-expressing B104 cells, MBCD treatment had no effect on TAG-1 bead attachment but the major part of the beads became stationary. As controls, addition of MBCD saturated with cholesterol or 8-h treatment with 10 mM neomycin did not change the behavior of TAG-1 bead. In NrCAMΔfnΔcyt-expressing B104 cells treated with MBCD, a low percentage of beads attached to the cell membrane and displayed a diffusive behavior. (B–E) Examples of TAG-1 bead behaviors on NrCAM-expressing cells. Under control condition, the TAG-1 bead displayed a retrograde mobility (V = 5.6 μm/min and D = 6.3 10-3 μm2 s-1; B). A stationary behavior of TAG-1 beads was observed on cells treated with 10 mM MBCD (C). This representative trajectory showed a directional velocity V = 0.7 μm/min and D = 1.0 10-3 μm2 s-1. In the presence of 10 mM MBCD and 1.7 mM cholesterol, TAG-1 beads showed a retrograde mobility (V = 3.9 μm/min and D = 0.4 10-3 μm2 s-1; D). Insets show filipin staining to check that MBCD efficiently depleted cholesterol from NrCAM-expressing cells (C), whereas the staining was back to control levels (B) when MBCD was saturated with exogenous cholesterol (D). NrCAM-expressing cells were treated for 8 h with neomycin to alter PIP2 metabolism (E). This representative trajectory shows that neomycin did not block the rearward mobility of TAG-1 beads (V = 2.7 μm/min and D = 1.9 10-3 μm2 s-1). (F–G) Examples of con-A bead behaviors on GFP-TM-expressing cells. Under control condition, the con-A bead displayed rearward mobility (V = 4.1 μm/min and D = 8.0 10-3 μm2 s-1)(F). After MBCD treatment, the con-A bead showed a retrograde mobility (V = 1.8 μm/min and D = 0.8 10-3 μm2 s-1; G). The beads are shown at the initial attachment site and the trajectory was deduced from the time-lapse recording during a 60-s period. Directional velocities and diffusion coefficients were calculated from the MSD curves.
Figure 7.
Figure 7.
Raft dispersion using MBCD altered TAG-1 bead-mediated clustering of NrCAM. (A and D) NrCAMΔfnΔcytexpressing cells were incubated for 15 min with 4-μm beads coupled with TAG-1IgFc and were treated or not with 10 mM MBCD for an additional 15 min. Then, cells were fixed with paraformaldehyde. Fluorescence imaging for GFP indicated a strong recruitment of GFP-tagged receptors that formed clusters at the bead-cell contacts under control condition (A and B). MBCD treatment resulted in the reduction of the size of GFP-clusters at cell-bead contacts and the GFP-cluster was even not detectable under some beads (asterisks; C and D). Bar, 5 μm. (E) Quantitative analysis of the percentage of beads that displayed a detectable GFP-cluster of NrCAM receptors under control condition or after MBCD treatment. (F) Individual diameters of the GFP-clusters were decreased after MBCD treatment when compared with the control. Statistical analysis using ANOVA indicated a significant effect (p < 0.001).
Figure 8.
Figure 8.
The effect of cholesterol depletion on the mobility of NrCAM analyzed by FRAP. Cells transfected with NrCAMΔfn (C) or NrCAMΔfnΔcyt (A, B, and D) were incubated for 20 min with 4-μm TAG-1 beads and then treated or not with 10 mM MBCD for 15 min. (A and B) Representative images of the FRAP sequence are shown for NrCAMΔfnΔcyt, and are similar to NrCAMΔfn. A 4-μm-diameter spot was photobleached in a region without a bead (A), or precisely on a bead-cell contact where the receptor is heavily clustered (B), and the fluorescence intensity was monitored. (C and D) Kinetics of the fluorescence recovery. Data are normalized to yield an intensity of zero immediately after photo-bleaching and represent the average of 6–12 individual traces. Plain curves are a fit through the data of the function Im*(1 - exp(-t/τ)), where Im is the recovery fraction and τ a recovery time.
Figure 9.
Figure 9.
Models for NrCAM mobility in the cell membrane modulated through interactions with the cytoplasmic region and raft-partitioning. TAG-1 beads (black) bind NrCAM receptors (green). Patches of receptors are stabilized within lipid rafts (blue circle on the membrane) and the cytoplasmic tail interacts with the actin cytoskeleton (red) via adaptors (yellow or blue). (A) Retrograde mobility of the TAG-1 bead under control condition. The bead recruits a high density of NrCAM receptors. Under the bead, NrCAM cytoplasmic domains are associated to rearward flowing actin filaments. This coupling occurs via unknown adaptors (yellow). (B) TAG-1 bead on NrCAM after cytochalasin D treatment. Actin bund-les are depolymerized. NrCAM coupling to remnant subcortical cytoskeletal network may account for the limited mobility of the bead. (C) Stationary behavior on NrCAMΔfnΔCter. TAG-1 bead is resistant to displacement by the laser trap. The C-terminal part of the NrCAM cytoplasmic tail is required for the coupling with the actin retrograde flow. In this condition, the highly reduced mobility of the bead may reflect the linkage of the proximal region of the cytoplamic tail to static subcortical actin filaments via adaptors (blue). (D) TAG-1 bead on NrCAMΔfnΔcyt. NrCAM is unable to interact directly to the cytoskeleton. The bead displays a reduced mobility and can be displaced by the laser trap. This immobile behavior altered by MBCD treatment, depends on the partitioning of NrCAM within a bead-induced stabilized raft. (E) TAG-1 bead on NrCAM after MBCD treatment. Coupling of NrCAM with the actin retrograde flow is prevented. The bead displays a stationary behavior and resists to the laser trap displacement. Disruption of rafts by MBCD impairs NrCAM clustering and the receptor avidity for its ligand is reduced. The density of NrCAM molecules under the bead may be too low to permit clutching with the actin retrograde flowing. The stationary behavior is due to interaction of the cytoplasmic tail with the subcortical actin.

Similar articles

Cited by

References

    1. Bennett, V., and Chen, L. (2001). Ankyrins and cellular targeting of diverse membrane proteins to physiological sites. Curr. Opin. Cell Biol. 13, 61-67. - PubMed
    1. Brümmendorf, T., and Rathjen, F.G. (1996). Structure/function relationships of axon-associated adhesion receptors of the immunoglobulin superfamily. Curr. Opin. Neurobiol. 6, 584-593. - PubMed
    1. Choquet, D., Felsenfeld, D.P., and Sheetz, M.P. (1997). Extracellular matrix rigidity causes strengthening of integrin-cytoskeleton linkages. Cell 88, 39-48. - PubMed
    1. Coussen, F., Choquet, D., Sheetz, M.P., and Erickson, H.P. (2002). Trimers of the fibronectin cell adhesion domain localize to actin filament bundles and undergo rearward translocation. J. Cell Sci. 115, 2581-2590. - PubMed
    1. Dahlin-Huppe, K., Berglund, E.O., Ranscht, B., and W.B. Stallcup. (1997). Mutational analysis of the L1 neuronal cell adhesion molecule identifies membrane-proximal amino acids of the cytoplasmic domain that are required for cytoskeletal anchorage. Mol. Cell Neurosci. 9, 144-156. - PubMed

Publication types

MeSH terms