. 2004 Jul 14;32(12):3724-33.
doi: 10.1093/nar/gkh686. Print 2004.

Prevalence of intron gain over intron loss in the evolution of paralogous gene families

Affiliations

Prevalence of intron gain over intron loss in the evolution of paralogous gene families

Vladimir N Babenko et al. Nucleic Acids Res. .

Abstract

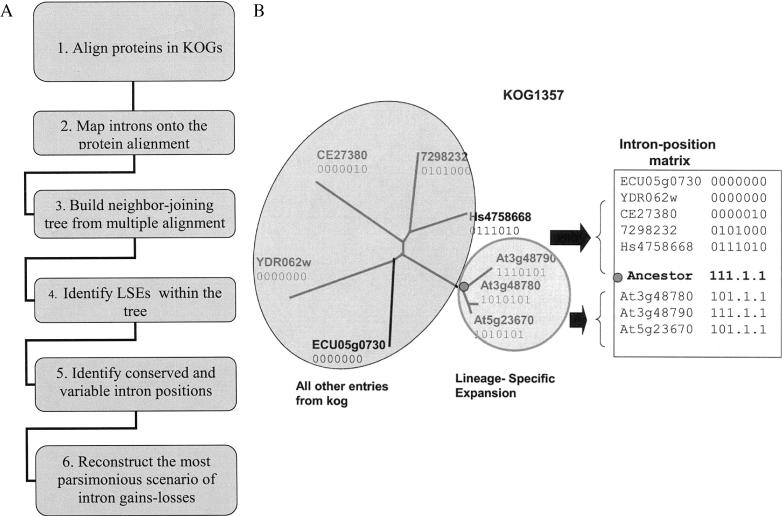
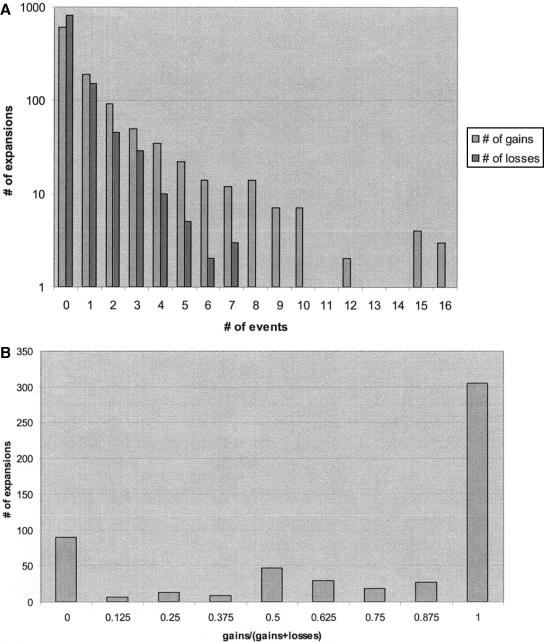
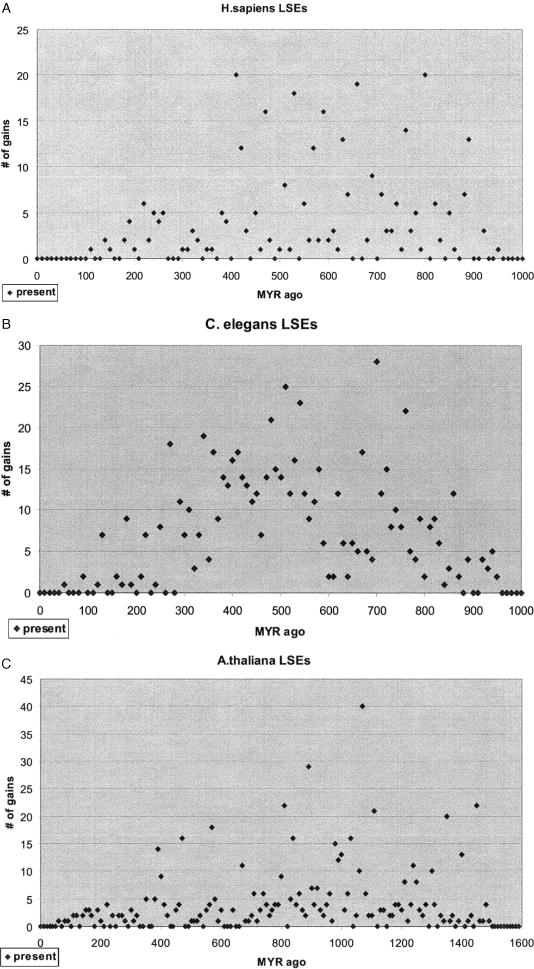
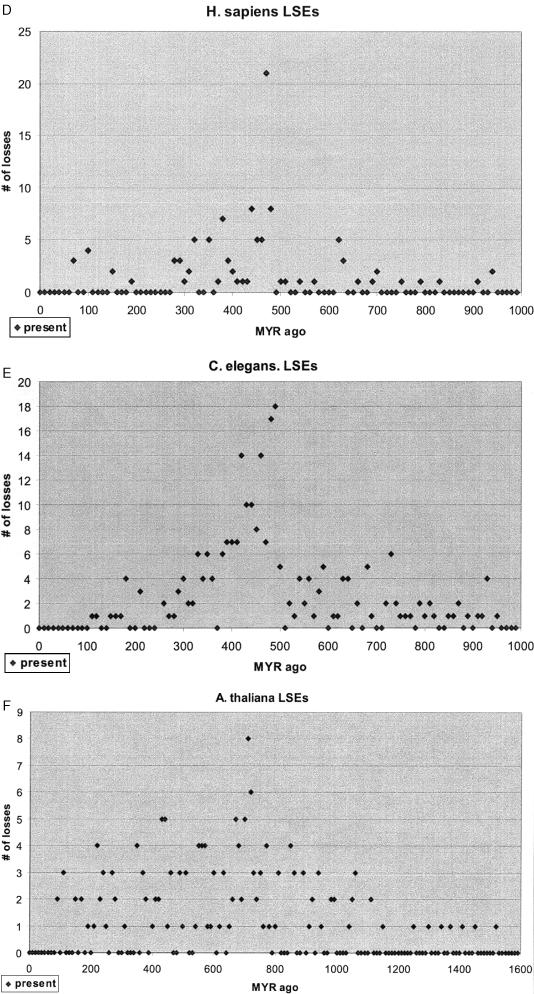
The mechanisms and evolutionary dynamics of intron insertion and loss in eukaryotic genes remain poorly understood. Reconstruction of parsimonious scenarios of gene structure evolution in paralogous gene families in animals and plants revealed numerous gains and losses of introns. In all analyzed lineages, the number of acquired new introns was substantially greater than the number of lost ancestral introns. This trend held even for lineages in which vertical evolution of genes involved more intron losses than gains, suggesting that gene duplication boosts intron insertion. However, dating gene duplications and the associated intron gains and losses based on the molecular clock assumption showed that very few, if any, introns were gained during the last approximately 100 million years of animal and plant evolution, in agreement with previous conclusions reached through analysis of orthologous gene sets. These results are generally compatible with the emerging notion of intensive insertion and loss of introns during transitional epochs in contrast to the relative quiet of the intervening evolutionary spans.


Figures

Figure 1
Figure 1
Computational strategy for the analysis of gene structure evolution of LSEs of paralogous genes. (A) Flow chart of the procedure. (B) Identification of an LSE, construction of the matrix of intron presence (1) and absence (0), and reconstruction of the gene structure of the last common ancestor of the LSE. The procedure is shown with a specific example, KOG1357 (serine palmitoyltransferase). Intron positions that contained introns in some members of the given KOG but not in the LSE, including its inferred ancestor, are denoted by dots. These positions were not part of the analysis of LSE evolution.
Figure 2
Figure 2
The procedure employed for approximate dating of intron gains and losses. The cartoon shows a neighbor-joining tree for an arbitrary LSE. For designations, see Materials and Methods.
Figure 3
Figure 3
Examples of reconstructed evolutionary scenarios of intron gain and loss in individual LSEs. (A) Neighbor-joining tree for the histone H3 family of A.thaliana, with intron presence–absence indicated for each of the paralogs and the reconstructed ancestral forms. Intron losses are shown with yellow shading. (B) Protein sequence alignment of A.thaliana histone H3 paralogs with intron positions shaded and intron phase indicated. (C) Neighbor-joining tree for the U5 snRNP-specific protein-like factor family of C.elegans [the designations are as in (A)]. Intron gains are shaded in blue. (D) Protein sequence alignment of C.elegans U5 snRNP-specific protein-like factor paralogs with intron positions shaded and intron phase indicated.
Figure 4
Figure 4
Distribution of the LSEs by the number of intron gains and losses. (A) Intron gains and losses in the LSEs. (B) Fraction of intron gains among the evolutionary events affecting gene structure in the LSEs. The numbers on the horizontal axis show the midpoints of the corresponding intervals.
Figure 5
Figure 5
Estimated age distributions of intron gains and losses in LSEs. (A) H.sapiens, gains; (B) C.elegans, gains; (C) A.thaliana, gains; (D) H.sapiens, losses; (E) C.elegans, losses; and (F) A.thaliana, losses. The dots on the horizontal axis show branches of the respective estimated age with no intron gains (losses).
Figure 5
Figure 5
Estimated age distributions of intron gains and losses in LSEs. (A) H.sapiens, gains; (B) C.elegans, gains; (C) A.thaliana, gains; (D) H.sapiens, losses; (E) C.elegans, losses; and (F) A.thaliana, losses. The dots on the horizontal axis show branches of the respective estimated age with no intron gains (losses).

Similar articles

Cited by

References

    1. Logsdon J.M. Jr (1998) The recent origins of spliceosomal introns revisited. Curr. Opin. Genet. Dev., 8, 637–648. - PubMed
    1. Lamond A.I. (1999) RNA splicing. Running rings around RNA. Nature, 397, 655–656. - PubMed
    1. Dacks J.B. and Doolittle,W.F. (2001) Reconstructing/deconstructing the earliest eukaryotes: how comparative genomics can help. Cell, 107, 419–425. - PubMed
    1. Lynch M. and Richardson,A.O. (2002) The evolution of spliceosomal introns. Curr. Opin. Genet. Dev., 12, 701–710. - PubMed
    1. Fedorov A., Merican,A.F. and Gilbert,W. (2002) Large-scale comparison of intron positions among animal, plant, and fungal genes. Proc. Natl Acad. Sci. USA, 99, 16128–16133. - PMC - PubMed