. 2004 Jul;114(2):240-9.
doi: 10.1172/JCI20964.

Hypertension and abnormal fat distribution but not insulin resistance in mice with P465L PPARgamma

Affiliations

Hypertension and abnormal fat distribution but not insulin resistance in mice with P465L PPARgamma

Yau-Sheng Tsai et al. J Clin Invest. 2004 Jul.

Abstract

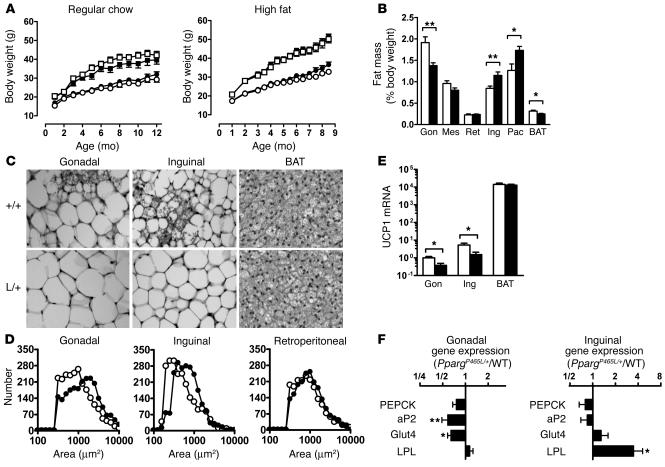
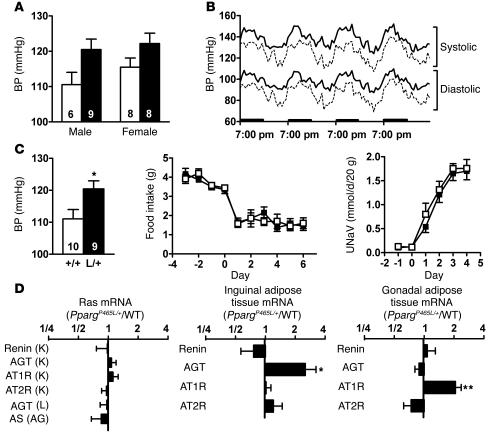
Peroxisome proliferator-activated receptor gamma (PPARgamma), the molecular target of a class of insulin sensitizers, regulates adipocyte differentiation and lipid metabolism. A dominant negative P467L mutation in the ligand-binding domain of PPARgamma in humans is associated with severe insulin resistance and hypertension. Homozygous mice with the equivalent P465L mutation die in utero. Heterozygous mice grow normally and have normal total adipose tissue weight. However, they have reduced interscapular brown adipose tissue and intra-abdominal fat mass, and increased extra-abdominal subcutaneous fat, compared with wild-type mice. They have normal plasma glucose levels and insulin sensitivity, and increased glucose tolerance. However, during high-fat feeding, their plasma insulin levels are mildly elevated in association with a significant increase in pancreatic islet mass. They are hypertensive, and expression of the angiotensinogen gene is increased in their subcutaneous adipose tissues. The effects of P465L on blood pressure, fat distribution, and insulin sensitivity are the same in both male and female mice regardless of diet and age. Thus the P465L mutation alone is sufficient to cause abnormal fat distribution and hypertension but not insulin resistance in mice. These results provide genetic evidence for a critical role for PPARgamma in blood pressure regulation that is not dependent on altered insulin sensitivity.


Figures

Figure 1
Figure 1
Generation of mice with the PPARγ P465L mutation. (A) Crossovers (indicated by the large X marks) between the wild-type mouse Pparg locus with Pro465 in exon 6 (6P) (top diagram) and targeting construct with Leu465 (6L) (second diagram) resulted in the targeted allele in ES cells (third diagram). The ACN (Cre-Neo) cassette, flanked by loxP sequences, was excised out of the mutant allele upon germline transmission (bottom diagram). B, X, Xb, and St indicate the BamHI, XhoI, XbaI, and StuI restriction enzyme sites, respectively. tAce, testis-specific Ace promoter; TK, thymidine kinase. (B) Southern blot analysis of genomic DNA. The targeted allele was identified by a 5′ probe that hybridizes to an 11-kb fragment in wild-type (+/+) DNA and to a 7.7-kb fragment in heterozygous DNA that includes the P465L mutation (L/+). (C) PPARγ mRNA of the wild-type (white bars) and mutant allele (black bar) in gonadal adipose tissue from wild-type and PpargP465L/+ mice (n = 8 each). The PPARγ mRNA amount is expressed relative to that of wild-type allele in wild-type mice. (D) Rosiglitazone-induced PEPCK expression in gonadal adipose tissue explants. Tissues isolated from four wild-type (open squares) and four PpargP465L/+ (filled squares) mice were incubated in cultured media containing various concentrations of PPARγ agonist rosiglitazone as indicated. The levels of PEPCK mRNA are relative to the wild-type basal level. *P < 0.01 and **P < 0.005 compared with the respective basal levels.
Figure 2
Figure 2
Altered adipose tissue distribution in PpargP465L/+ mice. (A) Body weights of male mice (open squares, wild-type, n = 9–10; filled squares, PpargP465L/+, n = 9–10) and female mice (open circles, wild-type, n = 7–9; filled circles, PpargP465L/+, n = 8) fed regular chow (left panel) or a high-fat diet (right panel). (B) Adipose tissue mass in 10-week-old female wild-type (white bars) and PpargP465L/+ (black bars) mice fed regular chow. Data are expressed as percent body weights. Gon, Mes, Ret, Ing, and Pec represent gonadal, mesenteric, retroperitoneal, inguinal, and pectoral white adipose tissue, respectively; BAT indicates interscapular BAT. *P < 0.05 and **P < 0.01, compared with wild-type littermates. (C) Morphology of gonadal and inguinal white adipose and brown adipose tissues from 10-week-old female mice fed regular chow. +/+, wild-type; L/+, PpargP465L/+. (D) Distribution of cell size in gonadal (left panel), inguinal (middle panel), and retroperitoneal (right panel) adipose tissues. Open circles, wild-type; filled circles, PpargP465L/+. (E) UCP1 mRNA relative to the level of gonadal adipose tissue from wild-type mice. *P < 0.05 between PpargP465L/+ and wild-type littermates (n = 16 each). The y axis is in a log scale. (F) Relative ratio of mRNA for PPARg target genes in gonadal and inguinal adipose tissues of PpargP465L/+ mice to those of wild-type mice (n = 16 each). *P < 0.05 and **P < 0.005 between PpargP465L/+ and wild-type littermates.
Figure 3
Figure 3
Increased glucose tolerance but normal insulin sensitivity in PpargP465L/+ mice. (A) Plasma glucose and insulin levels during the IPGTT in 14- to 16-week-old male mice fed regular chow (left panels; n = 15–16) or a high-fat diet (right panels; n = 7–11). Open squares, wild-type; filled squares, PpargP465L/+. *P < 0.05 versus wild-type. (B) IPITTs of 14- to 16-week-old female mice fed regular chow (left panel; n = 7–8) or a high-fat diet (right panel; n = 6–7). Open squares, wild-type; filled squares, PpargP465L/+. Data are expressed as the percentage of the plasma glucose before insulin injection. (C) Whole-body metabolic parameters during the hyperinsulinemic-euglycemic clamp experiment. Steady-state glucose infusion rates (top left) and insulin-stimulated whole-body glucose turnover rates (top right) were obtained for 10- to 12-week-old male mice fed regular chow (RC; n = 5) or a high-fat diet (HF; n = 5–8). White bars, wild-type; black bars, Pparg465L/+. *P < 0.05 for diet effect. Basal (bottom left) and clamped (bottom right) rates of HGP in wild-type (white bars) and Pparg465L/+ (black bars) mice fed regular chow (RC; n = 5) or a high-fat diet (HF; n = 5–8). (D) Morphometric analysis of pancreatic islets. Mean islet area (left), pancreatic endocrine mass (middle), and islet number (right) were measured in sections from 14- to 16-week-old male mice fed regular chow (RC; n = 4) or a high-fat diet (HF; n = 4). White bars, wild-type; black bars, Pparg465L/+. *P < 0.05 and **P < 0.001 compared with wild-type littermates.
Figure 4
Figure 4
Elevated BP in PpargP465L/+ mice. (A) BP of 14- to 16-week-old wild-type (white bars) and PpargP465L/+ (black bars) mice by tail-cuff measurement. Numbers of mice are inside bars. P < 0.01 for genotype effect by ANOVA. (B) Four-day telemetric recordings of systolic and diastolic BP in 24-week-old female mice. Results are expressed as mean of four wild-type (dashed lines) and four PpargP465L/+ (solid lines) mice averaged with 12 values each hour. Bolded bars on the x axis represent the dark cycles. (C) Responses to changes in dietary salt intake. BP of 14- to 16-week-old male wild-type (white bar) and PpargP465L/+ (black bar) mice fed a high-salt diet for 4 weeks (left panel). Numbers inside bars indicate sample size. *P < 0.05. Changes in daily food consumption (middle panel) and urinary sodium excretion (UNaV; right panel) after mice were switched to a high-salt diet at day 0 for 10- to 12-week-old male wild-type (open squares, n = 7) and PpargP465L/+ (filled squares, n = 6) mice. (D) Relative ratio of the expression of RAS genes in PpargP465L/+ mice to those in wild-type mice (n = 16 each). Left panel, organs of major RAS expression: K, kidney; L, liver; AG, adrenal gland. Middle panel, inguinal adipose tissue. Right panel, gonadal adipose tissue. *P < 0.05 and **P < 0.005 between PpargP465L/+ and wild-type mice.

Comment in

References

    1. Reaven GM. Role of insulin resistance in human disease. Diabetes. 1988;37:1595–1607. - PubMed
    1. Berger J, Moller DE. The mechanisms of action of PPARs. Annu. Rev. Med. 2002;53:409–435. - PubMed
    1. Tontonoz P, Hu E, Spiegelman BM. Stimulation of adipogenesis in fibroblasts by PPAR gamma 2, a lipid-activated transcription factor. Cell. 1994;79:1147–1156. - PubMed
    1. Barak Y, et al. PPAR gamma is required for placental, cardiac, and adipose tissue development. Mol. Cell. 1999;4:585–595. - PubMed
    1. Kubota N, et al. PPAR gamma mediates high-fat diet-induced adipocyte hypertrophy and insulin resistance. Mol. Cell. 1999;4:597–609. - PubMed

Publication types

MeSH terms