. 2004 Jul-Aug;6(4):323-31.
doi: 10.1593/neo.03418.

Human cytomegalovirus infection of tumor cells downregulates NCAM (CD56): a novel mechanism for virus-induced tumor invasiveness

Affiliations

Human cytomegalovirus infection of tumor cells downregulates NCAM (CD56): a novel mechanism for virus-induced tumor invasiveness

Roman A Blaheta et al. Neoplasia. 2004 Jul-Aug.

Abstract

Pathologic data indicate that human cytomegalovirus (HCMV) infection might be associated with the pathogenesis of several human malignancies. However, no definitive evidence of a causal link between HCMV infection and cancer dissemination has been established to date. This study describes the modulation of the invasive behavior of NCAM-expressing tumor cell lines by HCMV. Neuroblastoma (NB) cells, persistently infected with the HCMV strain AD169 (UKF-NB-4AD169 and MHH-NB-11AD169), were added to endothelial cell monolayers and adhesion and penetration kinetics were measured. The 140- and 180-kDa isoforms of the adhesion receptor NCAM were evaluated by flow cytometry, Western blot, and reverse transcription-polymerase chain reaction (RT-PCR). The relevance of NCAM for tumor cell binding was proven by treating NB with NCAM antisense oligonucleotides or NCAM transfection. HCMV infection profoundly increased the number of adherent and penetrated NB, compared to controls. Surface expression of NCAM was significantly lower on UKF-NB-4AD169 and MHH-NB-11AD169, compared to mock-infected cells. Western-blot and RT-PCR demonstrated reduced protein and RNA levels of the 140- and 180-kDa isoform. An inverse correlation between NCAM expression and adhesion capacity of NB has been shown by antisense and transfection experiments. We conclude that HCMV infection leads to downregulation of NCAM receptors, which is associated with enhanced tumor cell invasiveness.


Figures

Figure 1
Figure 1
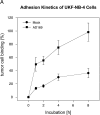
Adhesion kinetics of UKF-NB-4AD169 (A) and MHH-NB-11AD169 (B) versus mock-infected controls. NB cells were added at a density of 0.5 x 10⁶ cells/well to HUVEC monolayers for different time periods. Non-adherent tumor cells were washed off in each sample, and the remaining cells were fixed and counted in five different fields (5 x 0.25 mm2) using a phase-contrast microscope. Adhesion capacity is depicted as tumor cell binding and given in percentage of all cells added (mean ± SD; n = 5). X-axis indicates the period of coculture.
Figure 1
Figure 1
Adhesion kinetics of UKF-NB-4AD169 (A) and MHH-NB-11AD169 (B) versus mock-infected controls. NB cells were added at a density of 0.5 x 10⁶ cells/well to HUVEC monolayers for different time periods. Non-adherent tumor cells were washed off in each sample, and the remaining cells were fixed and counted in five different fields (5 x 0.25 mm2) using a phase-contrast microscope. Adhesion capacity is depicted as tumor cell binding and given in percentage of all cells added (mean ± SD; n = 5). X-axis indicates the period of coculture.
Figure 2
Figure 2
Penetration kinetics of UKF-NB-4AD169 (A) and MHH-NB-11AD169 (B) versus mock-infected controls. NB cells were added at a density of 0.5 x 10⁶ cells/well to HUVEC monolayers for different time periods. To identify transmigrated NB from the cells which had bound to HUVEC, a reflection interference contrast microscope with a Ploem apparatus was used (see Materials and Methods section for details). Five different observation fields (5 x 0.25 mm2) were chosen and mean penetration rate was evaluated in each sample. Penetration rate is given as percentage of all cells added (mean ± SD; n = 3). X-axis indicates the period of coculture.
Figure 2
Figure 2
Penetration kinetics of UKF-NB-4AD169 (A) and MHH-NB-11AD169 (B) versus mock-infected controls. NB cells were added at a density of 0.5 x 10⁶ cells/well to HUVEC monolayers for different time periods. To identify transmigrated NB from the cells which had bound to HUVEC, a reflection interference contrast microscope with a Ploem apparatus was used (see Materials and Methods section for details). Five different observation fields (5 x 0.25 mm2) were chosen and mean penetration rate was evaluated in each sample. Penetration rate is given as percentage of all cells added (mean ± SD; n = 3). X-axis indicates the period of coculture.
Figure 3
Figure 3
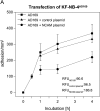
Graph (A) shows adhesion kinetics of UKF-NB-4AD169 transfected with 2 µg of full-length cDNA encoding the human NCAM-140-kDa isoform. Graph (B) demonstrates adhesion kinetics of parental UKF-NB-4 cells treated with 1 µg/ml NCAM antisense oligonucleotides. Control cells remained untreated or were either incubated with random antisense oligonucleotides or transfected with the expression vector alone. In all experiments, NB cells were added at a density of 0.5 x 10⁶ cells/well to HUVEC monolayers. Nonadherent tumor cells were washed off after different time periods, and the remaining cells were fixed and counted in five different fields (5 x 0.25 mm2) using a phase-contrast microscope. Data on NCAM surface expression, evaluated by flow cytometry, are also given in the lower right-hand corner and demonstrate the inverse correlation between NCAM expression level and adhesion capacity. X-axis indicates the period of coculture (mean ± SD, n = 3).
Figure 3
Figure 3
Graph (A) shows adhesion kinetics of UKF-NB-4AD169 transfected with 2 µg of full-length cDNA encoding the human NCAM-140-kDa isoform. Graph (B) demonstrates adhesion kinetics of parental UKF-NB-4 cells treated with 1 µg/ml NCAM antisense oligonucleotides. Control cells remained untreated or were either incubated with random antisense oligonucleotides or transfected with the expression vector alone. In all experiments, NB cells were added at a density of 0.5 x 10⁶ cells/well to HUVEC monolayers. Nonadherent tumor cells were washed off after different time periods, and the remaining cells were fixed and counted in five different fields (5 x 0.25 mm2) using a phase-contrast microscope. Data on NCAM surface expression, evaluated by flow cytometry, are also given in the lower right-hand corner and demonstrate the inverse correlation between NCAM expression level and adhesion capacity. X-axis indicates the period of coculture (mean ± SD, n = 3).
Figure 4
Figure 4
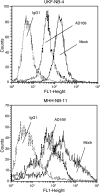
NCAM surface expression on UKF-NB-4 (top) and MHH-NB-11 cells (bottom). Tumor cells were disaggregated mechanically and washed in blocking solution. An FITC-conjugated monoclonal antibody anti-CD56, clone ERIC-1, was used to detect the NCAM 140- and 180-kDa isoform. A mouse IgG1-FITC served as the isotype control (IgG1). “AD169” depicts HCMV-infected cells; “Mock” is related to mock infected controls. Fluorescence was analyzed using a FACScan flow cytometer, and a histogram plot (FL1-Height) was generated to show FITC fluorescence.
Figure 5
Figure 5
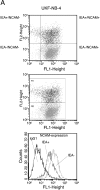
Two-color fluorescence analysis of HCMV-infected UKF-NB-4 (A) and MHH-NB-11 cells (B). At first, UKF-NB-4AD169 (Figure 4, top) or MHH-NB-11AD169 cell cultures (Figure 4, bottom) were fixed and washed twice in blocking solution. Subsequently, they were incubated for 60 minutes at 4°C with permeabilization medium, together with the monoclonal antibody directed against the HCMV-specific 72-kDa IEA (UL123), which was then coupled to Cy3 indocarbocyanine. In the second step, NB cells were marked with the FITC-conjugated anti-CD56 monoclonal antibody (see Materials and Methods section for details). Dot plot quadrant analyses have been carried out to display percentage distribution of NB-expressing Cy3-IEA and/or FITC-NCAM (IEA+/NCAM+, IEA+/NCAM-, IEA-/NCAM+, IEA-/NCAM-—upper diagram). IEA+ (R1) and IEA- (R2) cells were gated (middle diagram) to mark two distinct cell populations: population I (IEA+) as HCMV-infected cells and population II (IEA-) as noninfected NB cells. Mean fluorescence intensity of NCAM expression of both NB subtypes was then detected by FACscan analysis (FL-1H [log] channel histogram analysis; 530 nm peak fluorescence [lower diagram]).
Figure 5
Figure 5
Two-color fluorescence analysis of HCMV-infected UKF-NB-4 (A) and MHH-NB-11 cells (B). At first, UKF-NB-4AD169 (Figure 4, top) or MHH-NB-11AD169 cell cultures (Figure 4, bottom) were fixed and washed twice in blocking solution. Subsequently, they were incubated for 60 minutes at 4°C with permeabilization medium, together with the monoclonal antibody directed against the HCMV-specific 72-kDa IEA (UL123), which was then coupled to Cy3 indocarbocyanine. In the second step, NB cells were marked with the FITC-conjugated anti-CD56 monoclonal antibody (see Materials and Methods section for details). Dot plot quadrant analyses have been carried out to display percentage distribution of NB-expressing Cy3-IEA and/or FITC-NCAM (IEA+/NCAM+, IEA+/NCAM-, IEA-/NCAM+, IEA-/NCAM-—upper diagram). IEA+ (R1) and IEA- (R2) cells were gated (middle diagram) to mark two distinct cell populations: population I (IEA+) as HCMV-infected cells and population II (IEA-) as noninfected NB cells. Mean fluorescence intensity of NCAM expression of both NB subtypes was then detected by FACscan analysis (FL-1H [log] channel histogram analysis; 530 nm peak fluorescence [lower diagram]).
Figure 6
Figure 6
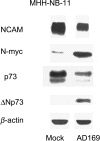
Western blot analysis of NCAM, N-myc, p73, and ΔNp73 from the proteins of MHH-NB-11 cells. MHH-NB-11 cells were either mock-infected or permanently infected with HCMV strain AD169. Cell lysates were subjected to sodium dodecyl sulfate polyacrylamide gel electrophoresis (SDS-PAGE) and blotted on the membrane incubated with anti-NCAM (clone ERIC-1), anti-N-myc (clone AB-1, anti-p73 (clone ER-15), or anti-ΔNp73 (clone 38C674) monoclonal antibodies. β-Actin served as the internal control. The figure shows one representative from three separate experiments.
Figure 7
Figure 7
RT-PCR analysis of NCAM 140- and 180-kDa RNA in MHH-NB-11AD169 cells (AD169) versus mock-infected controls (mock). RNA were extracted, reverse-transcribed, and submitted to semiquantitative RT-PCR using gene-specific primers as indicated in Materials and Methods section. The figure shows one representative from three separate experiments.
Figure 8
Figure 8
Schematic model of HCMV-triggered tumor dissemination. HCMV amplifies both N-myc and ΔNp73. Overexpression of the ΔNp73 isoform generates a functional block of p73, with the net effect of NCAM downregulation. Loss of NCAM is strongly associated with enhanced tumor transmigration (see text for further details).

Similar articles

Cited by

References

    1. Cobbs CS, Harkins L, Samanta M, Gillespie GY, Bharara S, King PH, Nabors LB, Cobbs CG, Britt WJ. Human cytomegalovirus infection and expression in human malignant glioma. Cancer Res. 2002;62:3347–3350. - PubMed
    1. Samanta M, Harkins L, Klemm K, Britt WJ, Cobbs CS. High prevalence of human cytomegalovirus in prostatic intraepithelial neoplasia and prostatic carcinoma. J Urol. 2003;170:998–1002. - PubMed
    1. Harkins L, Volk AL, Samanta M, Mikolaenko I, Britt WJ, Bland KI, Cobbs CS. Specific localisation of human cytomegalovirus nucleic acids and proteins in human colorectal cancer. Lancet. 2002;360:1557–1563. - PubMed
    1. Cinatl J, Jr, Cinatl J, Vogel JU, Kotchetkov R, Driever PH, Kabickova H, Kornhuber B, Schwabe D, Doerr HW. Persistent human cytomegalovirus infection induces drug resistance and alteration of programmed cell death in human neuroblastoma cells. Cancer Res. 1998;58:367–372. - PubMed
    1. Cinatl J, Jr, Kotchetkov R, Scholz M, Cinatl J, Vogel JU, Driever PH, Doerr HW. Human cytomegalovirus infection decreases expression of thrombospondin-1 independent of the tumor suppressor protein p53. Am J Pathol. 1999;155:285–292. - PMC - PubMed

Publication types