Comparative Study
. 2004 Jul 15;18(14):1766-79.
doi: 10.1101/gad.1207504.

Topological domain structure of the Escherichia coli chromosome

Affiliations
Comparative Study

Topological domain structure of the Escherichia coli chromosome

Lisa Postow et al. Genes Dev. .

Abstract

The circular chromosome of Escherichia coli is organized into independently supercoiled loops, or topological domains. We investigated the organization and size of these domains in vivo and in vitro. Using the expression of >300 supercoiling-sensitive genes to gauge local chromosomal supercoiling, we quantitatively measured the spread of relaxation from double-strand breaks generated in vivo and thereby calculated the distance to the nearest domain boundary. In a complementary approach, we gently isolated chromosomes and examined the lengths of individual supercoiled loops by electron microscopy. The results from these two very different methods agree remarkably well. By comparing our results to Monte Carlo simulations of domain organization models, we conclude that domain barriers are not placed stably at fixed sites on the chromosome but instead are effectively randomly distributed. We find that domains are much smaller than previously reported, approximately 10 kb on average. We discuss the implications of these findings and present models for how domain barriers may be generated and displaced during the cell cycle in a stochastic fashion.


Figures

Figure 1.
Figure 1.
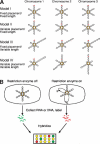
(A) Models for domain organization. Four models are presented that differ in the variability of barrier placement and domain length. For each model, three different chromosomes are shown, which may depict chromosomes in different cells or in the same cell at different times. Domain barriers are indicated with yellow boxes. A marker gene is shown in red to demonstrate the variability in barrier position. For simplicity, we have divided each chromosome into only six domains. (B) Experimental scheme for microarray experiments. Cleavage of the chromosome will relax domains containing the cut site but leave uncut domains negatively supercoiled. DNA relaxation at numerous sites around the chromosome can be quantified using the expression of supercoiling sensitive genes (SSGs). To measure the expression of SSGs following cleavage, RNA was collected from cells prior to or following the expression of an active restriction endonuclease, labeled with either the dye Cy3 (green, reference) or Cy5 (red, sample), and used to probe microarrays containing PCR products from ORFs in the E. coli genome. The ratio of red to green signal measures the relative abundance of the transcripts from a particular gene. A yellow signal indicates about equal abundance of the reference and sample RNAs. To measure degradation from cut sites, genomic DNA was isolated from cells instead of RNA.
Figure 2.
Figure 2.
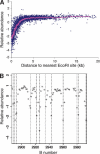
EcoRI cleavage in vivo. Shown are data taken 4 h after the shift to the permissive temperature for EcoRI. (A) The log2 of the relative abundance of each ORF following the shift to the permissive temperature is plotted versus the distance of each ORF to its nearest EcoRI site (blue dots). A moving average over a window size of 30 data points is shown in purple. Window sizes in this and in subsequent figures have been optimized to yield a faithful display of the data (judged by comparison with smaller window sizes), while minimizing random fluctuations. The data were normalized such that the average ratio in the red and green channels over all ORFs is 1. Because of DNA degradation, the ratio for intact ORFs is 1.6, or 0.7 on the log2 scale shown. (B) DNA abundance data (circles) from a segment of the genome in A replotted with respect to the B numbers of the genes that indicate their linear order along the chromosome (Blattner et al. 1997). Vertical dotted lines indicate the closest ORF to each EcoRI site. In the plot shown, the DNA from every gene that falls on a dotted line is either a local minimum or is present at less than half the level of the average of all genes. Therefore, all 12 genes in this plot show degradation from the cut site.
Figure 3.
Figure 3.
Cleavage of genomic DNA by SwaI in vivo. (A) SwaI was induced and genomic DNA was isolated at the times indicated, cleaved with PvuI, run on an agarose gel, and Southern blotted. The probed DNA is a PvuI fragment that contains a SwaI site. Digestion with SwaI cleaves the original 8.8-kb PvuI fragment into products with lengths of 3.4 and 5.4 kb. The probe hybridizes only to the 5.4-kb fragment. M: Genomic DNA from the 0-min time point digested in vitro with both SwaI and PvuI. (B) Quantification of the results from A. (C,D) Genomic DNA was isolated from cells after SwaI induction and used to probe microarrays. (C) The log2 of the relative abundance of each ORF after 45 min of SwaI induction is plotted relative to the distance of each ORF to its nearest SwaI site (blue dots). A moving average over 80 points is in black. (D) The moving averages (over 80 points) are shown for the relative abundance of ORFs 30 min (turquoise), 45 min (black), and 60 min (purple) following SwaI induction.
Figure 4.
Figure 4.
Gene expression in vivo following cleavage by SwaI. RNA was isolated from cells following SwaI induction and used to probe microarrays. The log2 of the relative transcription of genes was plotted relative to the distance of each gene to its nearest SwaI site. (A,B) The expression of relaxation-repressed genes. (A) The expression of each relaxation-repressed gene following 45 min of SwaI induction is indicated by green dots. A moving average over 20 points is shown in black. (B) The moving averages (over 20 points) are shown for the 30-min (turquoise), 45-min (black), and 60-min (purple) time points. The expression of relaxation-induced genes following 45 min of SwaI induction is plotted with a 10-point moving average through the data in C, and the expression of all non-SSGs following 45 min of SwaI induction is plotted with an 80-point moving average in D.
Figure 5.
Figure 5.
Effect of ectopic SwaI sites on the expression of two relaxation-repressed genes. (A) Strains were constructed in which one of five SwaI sites (A-E) was inserted within a 204-kb region devoid of endogenous SwaI sites. The positions of the boundary SwaI sites, as well as the positions of the relaxation-repressed genes dapA and xseA, are shown. A 10-kb size reference is indicated. (B) RNA from the wild-type strain (W) and from strains containing one of the ectopic SwaI sites (A-E) was incubated in the presence (+) or absence (-) of 32P-labeled probes for dapA and mreB, treated with RNase, and run on a denaturing polyacrylamide gel. Control lanes lacking RNase (-) were also included. Indicated are the positions of the dapA probe (dp), the mreB probe (mp), the dapA protected fragment (df), and the mreB protected fragment (mf). Measurements of dapA and xseA transcription were performed in duplicate, and the results, quantified using a PhosphorImager, are shown in C. All values are normalized to the internal mreB control, and expressions are relative to that in the wild-type strain for a given experiment. An exponential curve is shown, indicating an average domain size of 11 kb. Error bars indicate one standard deviation. The order of values along the X-axis, from left to right, correspond to strains D, C, E, D, B, C, A, E, B, W/A, and W.
Figure 6.
Figure 6.
Comparison of transcription measured with microarrays to Monte Carlo simulations. The probability of an SSG being relaxed is plotted as a function of distance from a SwaI site. Measurements of the transcription of relaxation-repressed genes by microarrays 45 min following SwaI induction were binned in the following increments: 0-5 kb, 5-10 kb, 10-15 kb, 15-20 kb, 20-25 kb, 25-35 kb, and 35-65 kb, and normalized such that most values are between 0 (unchanged) and 1 (repressed) so that the experimental and simulated data sets could be directly compared. These normalized values are equivalent to the probability of relaxation, and we have used this terminology for clarity and for comparisons in Figure 7. The average value for each bin is plotted at the midpoint of the binned distances. Experimental values for distances >65 kb average to a negative value, and thus are excluded from these graphs. Values from Monte Carlo simulations for models II and IV were treated identically and plotted. (A) The binned transcriptional microarray data (black triangles) and the best-fit values for model II (open squares) and model IV (open circles) simulation data are plotted on a semi-log graph. Both the model IV data and the transcription data fall on a straight line corresponding to an average domain size of 9 kb. In contrast, the best-fit model II values correspond to a domain size of 23 kb and do not fit a straight line on this semi-log graph. The model II simulation values go to 0 when the domain length is exceeded, and this cannot be represented on the log scale shown. (B) The transcriptional microarray data (black triangles) were compared to model IV simulations using average domain sizes that varied from 6 kb to 15 kb, as indicated above each line. The data points fall between the best-fit lines for average domain sizes of 8 and 12 kb, with the exception of the outlier in the last bin.
Figure 7.
Figure 7.
Supercoiled loop measurements from electron micrographs of isolated chromosomes. (A) E. coli chromosomes were gently isolated by sucrose gradient sedimentation and spread onto carbon-coated electron microscopy grids. A representative chromosome is shown, photographed at 12,000× magnification. Bar, 500 nm. (B) A similarly treated 7-kb negatively supercoiled plasmid photographed at 50,000× magnification. Bar, 100 nm. (C) Quantification of loop sizes from electron micrographs. We traced 169 clearly defined supercoiled loops and compared their lengths to that of a 7-kb plasmid. Loop sizes were binned in 2-kb increments and plotted as a histogram. (D) Comparison of domain sizes from microarray and electron microscopy (EM) experiments. The cumulative probability of loop sizes measured by EM (gray squares) and of domain sizes from transcriptional microarray experiments (black triangles) are plotted. Microarray data were binned as in Figure 6. The lines show the best-fit exponential function to each data set. Because loops <10 kb were difficult to score by EM, the data points corresponding to these loop sizes were not included in fitting the exponential function. The best-fit exponential functions indicate a domain size of 9 kb for the microarray data and 11 kb for the microscopy data. The vertical displacement between the two data sets is due to the paucity of small loop measurements in the microscopy data set.

References

    1. Aussel L., Barre, F.X., Aroyo, M., Stasiak, A., Stasiak, A.Z., and Sherratt, D. 2002. FtsK Is a DNA motor protein that activates chromosome dimer resolution by switching the catalytic state of the XerC and XerD recombinases. Cell 108: 195-205. - PubMed
    1. Bernstein J.A., Khodursky, A.B., Lin, P.H., Lin-Chao, S., and Cohen, S.N. 2002. Global analysis of mRNA decay and abundance in Escherichia coli at single-gene resolution using two-color fluorescent DNA microarrays. Proc. Natl. Acad. Sci. 99: 9697-9702. - PMC - PubMed
    1. Blattner F.R., Plunkett III, G., Bloch, C.A., Perna, N.T., Burland, V., Riley, M., Collado-Vides, J., Glasner, J.D., Rode, C.K., Mayhew, G.F., et al. 1997. The complete genome sequence of Escherichia coli K-12. Science 277: 1453-1474. - PubMed
    1. Bliska J.B. and Cozzarelli, N.R. 1987. Use of site-specific recombination as a probe of DNA structure and metabolism in vivo. J. Mol. Biol. 194: 205-218. - PubMed
    1. Case R., Chang, Y., Smith, S., Gore, J., Cozzarelli, N., and Bustamante, C. 2004. The bacterial condensin MukBEF compacts DNA into a repetitive, stable structure. Science (in press). - PubMed

Publication types

MeSH terms