

Incongruent patterns of local and global genome size evolution in cotton
- PMID: 15256507
- PMCID: PMC509256
- DOI: 10.1101/gr.2673204
Incongruent patterns of local and global genome size evolution in cotton
Abstract
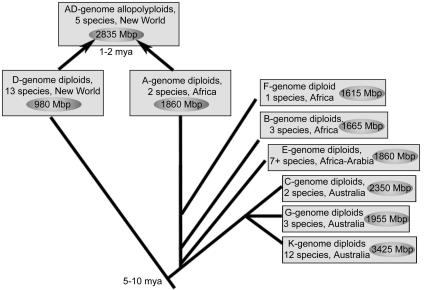
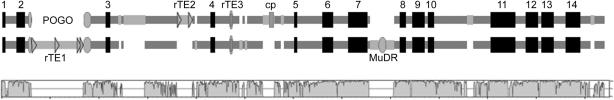
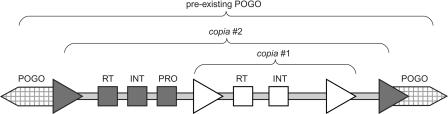
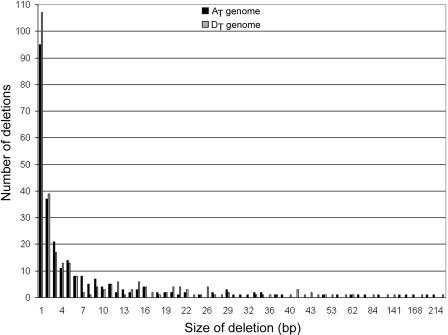
Genome sizes in plants vary over several orders of magnitude, reflecting a combination of differentially acting local and global forces such as biases in indel accumulation and transposable element proliferation or removal. To gain insight into the relative role of these and other forces, approximately 105 kb of contiguous sequence surrounding the cellulose synthase gene CesA1 was compared for the two coresident genomes (AT and DT) of the allopolyploid cotton species, Gossypium hirsutum. These two genomes differ approximately twofold in size, having diverged from a common ancestor approximately 5-10 million years ago (Mya) and been reunited in the same nucleus at the time of polyploid formation, approximately 1-2 Mya. Gene content, order, and spacing are largely conserved between the two genomes, although a few transposable elements and a single cpDNA fragment distinguish the two homoeologs. Sequence conservation is high in both intergenic and genic regions, with 14 conserved genes detected in both genomes yielding a density of 1 gene every 7.5 kb. In contrast to the twofold overall difference in DNA content, no disparity in size was observed for this 105-kb region, and 555 indels were detected that distinguish the two homoeologous BACs, approximately equally distributed between AT and DT in number and aggregate size. The data demonstrate that genome size evolution at this phylogenetic scale is not primarily caused by mechanisms that operate uniformly across different genomic regions and components; instead, the twofold overall difference in DNA content must reflect locally operating forces between gene islands or in largely gene-free regions.
Copyright Cold Spring Harbor Laboratory Press ISSN
Figures
References
-
- Adams, K.L. and Palmer, J.D. 2003. Evolution of mitochondrial gene content: Gene loss and transfer to the nucleus. Mol. Phylogenet. Evol. 29: 380–395. - PubMed
-
- The Arabidopsis Genome Initiative. 2000. Analysis of the genome sequence of the flowering plant, Arabidopsis thaliana. Nature 408: 796–815.8 - PubMed
-
- Bennett, M.D. 1985. Intraspecific variation in DNA amount and the nucleotypic dimension in plant genetics. In Plant genetics (ed. M. Freeling), pp. 283–302. A.R. Liss, New York.
-
- Bennett, M.D. 1987. Variation in genomic form and its ecological implications. New Phytol. 106: 177–200.
-
- Bennett, M.D. and Leitch, I.J. 1995. Nuclear DNA amounts in angiosperms. Annals Bot. 76: 113–176.
WEB SITE REFERENCES
-
- http://ftp.genome.washington.edu/RM/RepeatMasker.html; RepeatMasker.
-
- http://lagan.stanford.edu/; LAGAN alignment toolkit.
-
- http://www.genomesize.com; Animal genome size database.
-
- http://www.mbio.ncsu.edu/BioEdit/bioedit.html; Biological sequence alignment editor.
-
- http://www.phrap.org/; Phred/Phrap/Consed.
Publication types
MeSH terms
Substances
Associated data
- Actions
- Actions
LinkOut - more resources
Full Text Sources