

The binding sites for the chromatin insulator protein CTCF map to DNA methylation-free domains genome-wide
- PMID: 15256511
- PMCID: PMC509268
- DOI: 10.1101/gr.2408304
The binding sites for the chromatin insulator protein CTCF map to DNA methylation-free domains genome-wide
Abstract
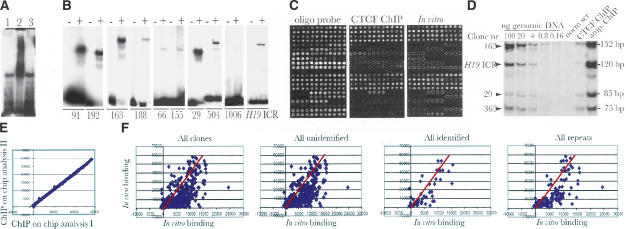
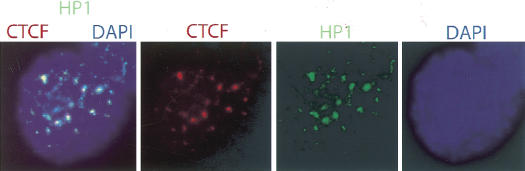
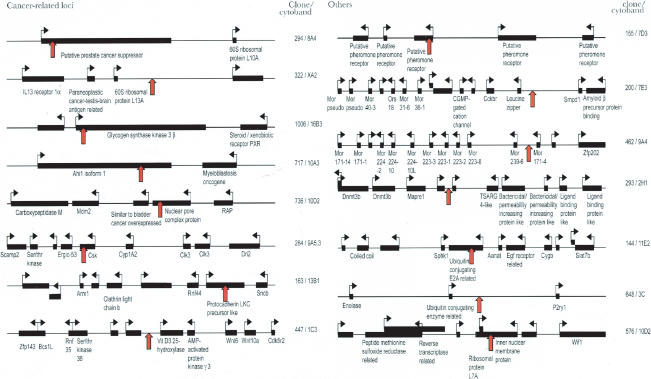
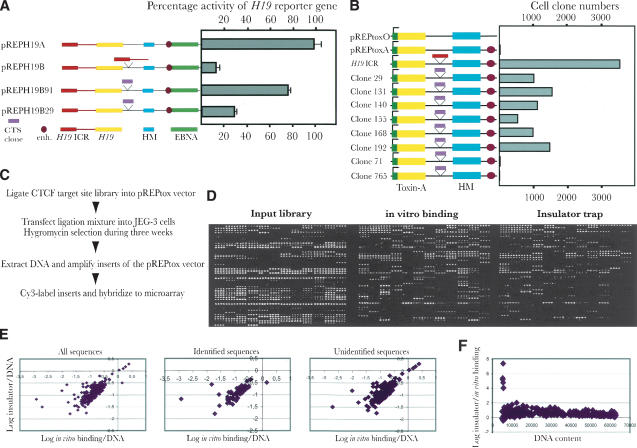
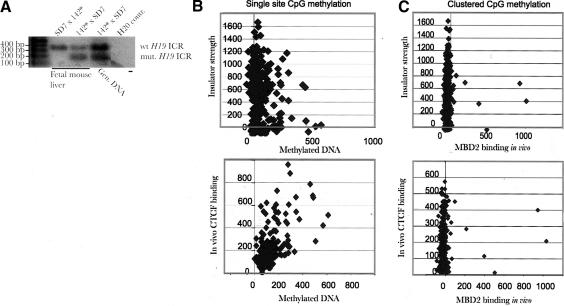
All known vertebrate chromatin insulators interact with the highly conserved, multivalent 11-zinc finger nuclear factor CTCF to demarcate expression domains by blocking enhancer or silencer signals in a position-dependent manner. Recent observations document that the properties of CTCF include reading and propagating the epigenetic state of the differentially methylated H19 imprinting control region. To assess whether these findings may reflect a universal role for CTCF targets, we identified more than 200 new CTCF target sites by generating DNA microarrays of clones derived from chromatin-immunopurified (ChIP) DNA followed by ChIP-on-chip hybridization analysis. Target sites include not only known loci involved in multiple cellular functions, such as metabolism, neurogenesis, growth, apoptosis, and signalling, but potentially also heterochromatic sequences. Using a novel insulator trapping assay, we also show that the majority of these targets manifest insulator functions with a continuous distribution of stringency. As these targets are generally DNA methylation-free as determined by antibodies against 5-methylcytidine and a methyl-binding protein (MBD2), a CTCF-based network correlates with genome-wide epigenetic states.
Copyright 2004 Cold Spring Harbor Laboratory Press ISSN
Figures
References
-
- Ballestar, E. and Wolffe, A. 2001. Methyl-CpG-binding proteins. Targeting specific gene repression. Eur. J. Biochem. 268: 1–6. - PubMed
-
- Bell, A.C. and Felsenfeld, G. 2000. Methylation of a CTCF-dependent boundary controls imprinted expression of the Igf2 gene. Nature 405: 482–485. - PubMed
-
- Bell, A.C., West, A.G., and Felsenfeld, G. 2001. Insulators and boundaries: Versatile regulatory elements in the eukaryotic genome. Science 291: 447–450. - PubMed
-
- Filippova, G., Fagerlie, S., Klenova, E., Myers, C., Dehner, Y., Goodwin, G., Neiman, P., Collins, S., and Lobanenkov, V. 1996. An exceptionally conserved transcriptional repressor, CTCF, employs different combinations of zinc fingers to bind diverged promoter sequences of avian and mammalian c-myc oncogenes. Mol. Cell Biol. 16: 2802–2813. - PMC - PubMed
WEB SITE REFERENCES
-
- http://ftp.genome.washington.edu/RM/RepeatMasker.html; RepeatMasker site.
-
- www.geneontology.org; Gene Ontology database.
-
- http://bioinfo.pbi.nrc.ca:8090/EMBOSS/index.html; the EMBOSS sequence analysis suite.
Publication types
MeSH terms
Substances
Associated data
- Actions
- Actions
- Actions
- Actions
- Actions
- Actions
- Actions
- Actions
- Actions
- Actions
- Actions
- Actions
- Actions
- Actions
- Actions
- Actions
- Actions
- Actions
- Actions
- Actions
- Actions
- Actions
- Actions
- Actions
- Actions
- Actions
- Actions
- Actions
- Actions
- Actions
- Actions
- Actions
- Actions
- Actions
- Actions
- Actions
- Actions
- Actions
- Actions
- Actions
- Actions
- Actions
- Actions
- Actions
- Actions
- Actions
- Actions
- Actions
- Actions
- Actions
- Actions
- Actions
- Actions
- Actions
- Actions
- Actions
- Actions
- Actions
- Actions
- Actions
- Actions
- Actions
- Actions
- Actions
- Actions
- Actions
- Actions
- Actions
- Actions
- Actions
- Actions
- Actions
- Actions
- Actions
- Actions
- Actions
- Actions
- Actions
- Actions
- Actions
- Actions
- Actions
- Actions
- Actions
- Actions
- Actions
- Actions
- Actions
- Actions
- Actions
- Actions
- Actions
- Actions
- Actions
- Actions
- Actions
- Actions
- Actions
- Actions
- Actions
- Actions
- Actions
- Actions
- Actions
- Actions
- Actions
- Actions
- Actions
- Actions
- Actions
- Actions
- Actions
- Actions
- Actions
- Actions
- Actions
- Actions
- Actions
- Actions
- Actions
- Actions
- Actions
- Actions
- Actions
- Actions
- Actions
- Actions
- Actions
- Actions
- Actions
- Actions
- Actions
- Actions
- Actions
- Actions
- Actions
- Actions
- Actions
- Actions
- Actions
- Actions
- Actions
- Actions
- Actions
- Actions
- Actions
- Actions
- Actions
- Actions
- Actions
- Actions
- Actions
- Actions
- Actions
- Actions
- Actions
- Actions
- Actions
- Actions
- Actions
- Actions
- Actions
- Actions
- Actions
- Actions
- Actions
- Actions
- Actions
- Actions
- Actions
- Actions
- Actions
- Actions
- Actions
- Actions
- Actions
- Actions
- Actions
- Actions
- Actions
- Actions
- Actions
- Actions
- Actions
- Actions
- Actions
- Actions
- Actions
- Actions
- Actions
- Actions
- Actions
- Actions
- Actions
- Actions
- Actions
- Actions
- Actions
- Actions
- Actions
- Actions
- Actions
- Actions
- Actions
- Actions
- Actions
- Actions
- Actions
- Actions
- Actions
- Actions
- Actions
- Actions
- Actions
- Actions
- Actions
- Actions
- Actions
- Actions
- Actions
- Actions
- Actions
- Actions
- Actions
- Actions
- Actions
- Actions
- Actions
- Actions
- Actions
- Actions
- Actions
- Actions
- Actions
- Actions
- Actions
- Actions
- Actions
- Actions
- Actions
- Actions
- Actions
- Actions
- Actions
- Actions
- Actions
- Actions
- Actions
- Actions
- Actions
- Actions
- Actions
- Actions
- Actions
- Actions
- Actions
- Actions
- Actions
- Actions
- Actions
- Actions
- Actions
- Actions
- Actions
- Actions
- Actions
- Actions
- Actions
- Actions
- Actions
- Actions
- Actions
- Actions
- Actions
- Actions
- Actions
- Actions
- Actions
- Actions
- Actions
- Actions
- Actions
- Actions
- Actions
- Actions
- Actions
- Actions
- Actions
- Actions
- Actions
- Actions
- Actions
- Actions
- Actions
- Actions
- Actions
- Actions
- Actions
- Actions
- Actions
- Actions
- Actions
- Actions
- Actions
- Actions
- Actions
- Actions
- Actions
- Actions
- Actions
- Actions
- Actions
- Actions
- Actions
- Actions
- Actions
- Actions
- Actions
- Actions
- Actions
- Actions
- Actions
- Actions
- Actions
- Actions
- Actions
- Actions
- Actions
- Actions
- Actions
- Actions
- Actions
- Actions
- Actions
- Actions
- Actions
- Actions
- Actions
- Actions
- Actions
- Actions
- Actions
- Actions
- Actions
- Actions
- Actions
- Actions
- Actions
- Actions
- Actions
- Actions
- Actions
- Actions
- Actions
- Actions
- Actions
- Actions
- Actions
- Actions
- Actions
- Actions
- Actions
- Actions
- Actions
- Actions
- Actions
- Actions
- Actions
- Actions
- Actions
- Actions
- Actions
- Actions
- Actions
- Actions
- Actions
- Actions
- Actions
- Actions
- Actions
- Actions
- Actions
- Actions
- Actions
- Actions
- Actions
- Actions
- Actions
- Actions
- Actions
- Actions
LinkOut - more resources
Full Text Sources
Other Literature Sources
Research Materials
Miscellaneous