. 2004 Jul 27;101(30):11129-34.
doi: 10.1073/pnas.0402347101. Epub 2004 Jul 15.

Variable var transition rates underlie antigenic variation in malaria

Affiliations

Variable var transition rates underlie antigenic variation in malaria

Paul Horrocks et al. Proc Natl Acad Sci U S A. .

Abstract

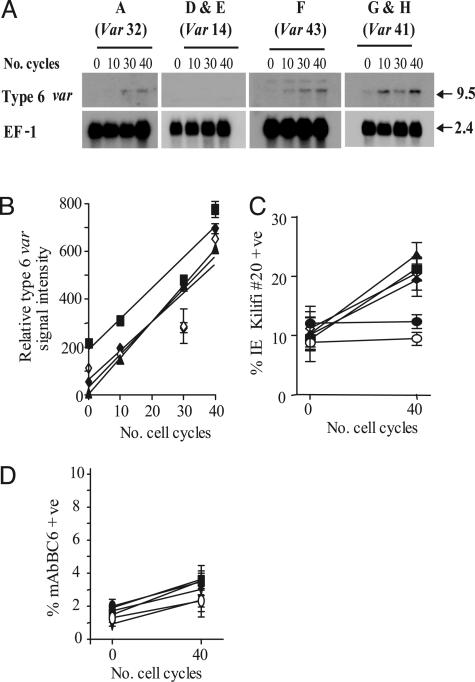
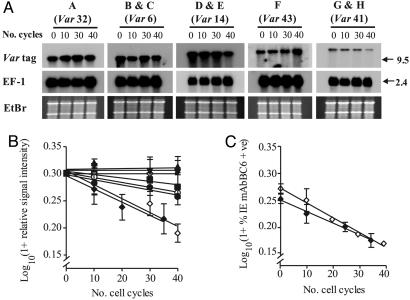
Plasmodium falciparum erythrocyte membrane protein 1 (PfEMP1) is expressed on the surface of infected erythrocytes where it plays a central role in both infected erythrocytes cytoadhesion and immune evasion. Switches in clonal expression of PfEMP1 result in antigenic variation that facilitates long-term chronic infection of the host. The var gene family encodes PfEMP1 variants, with transcriptional switching between different var variants providing the molecular basis for antigenic variation. Despite the importance of var transcriptional switching in the evasion of the immune response, little is known about the way in which this process is regulated. Here we report the measurement of transition on and off rates for a series of var gene variants. We find (i) that on and off rates for a given variant are dissimilar, (ii) that these rates vary dramatically among different variants, and (iii) that in isogenic clones expressing the same var gene, both on and off rates are constant and appear to be an intrinsic property of that particular gene. These data would suggest that the information that determines the probability of the activation or silencing of var genes is present in their surrounding DNA. Furthermore, some transitions appear to be disallowed depending on the recent variant antigen expression history of the parasite clone. These findings have important implications for both the underlying molecular mechanisms of antigenic variation and the processes that promote chronicity of infection in vivo.


Figures

Fig. 1.
Fig. 1.
Var transcription patterns in a panel of isogenic P. falciparum clones. The var variant transcribed by each of the 38 clones derived by cloning of rosette-selected A4 isolate are indicated. Filled black boxes represent a single major transcript, with gray boxes representing a mix of var transcript signals. Clones selected for further analysis are indicated in bold. Two further clones derived from an A4 isolate selected for expression of the type 41 var PfEMP1 product (G and H) are also indicated. Rosetting frequency (R+ Freq.) represents the percentage of infected erythrocytes bound to two or more uninfected erythrocytes. The mean of three independent experiments is shown.
Fig. 2.
Fig. 2.
Var transcript on-rates (ron) are fixed in P. falciparum.(A) Steady-state transcript levels of type 6 var in clones A and D–H over 40 cycles of intraerythrocytic growth. The predominant var type transcribed in each of these parasite clones is indicated above their respective panels. Clones B and C are not shown because var type 6 is the predominant transcript in these clones. The size of each transcript is described in kb. The hybridization signal from the control transcript EF-1α is indicated as used for one of several loading and staging controls. (B) Analysis of the relative increase in type 6 var transcript in clones A and F–H over 40 cycles of cell growth. Logarithmic regression of the mean relative signal intensity (±SEM, n = 3) indicates that type 6 var accumulates at the same rate (ron = 0.25% per generation) in all of these clones. Data points for each clone are represented as follows; clone A (▴), clone F (▪), and clones G and H (♦ and ⋄). (C) Flow cytometry analysis of type 6 var-encoded PfEMP1 molecule expression. The proportion of infected erythrocytes (mean ± SEM, n = 3) recognized by var type 6-specific serum (kilifi#20) over 40 cycles of growth is indicated. Whereas the proportion of infected erythrocytes in clones A and F–H recognized by kilifi#20 increases at a mean ron of 0.25% per generation, there is no appreciable increase in kilifi#20 binding to clones D and E (• and ○) over the same period. (D) Flow cytometry analysis of type 41 var-encoded PfEMP1 molecule expression in clones A–F. The proportion of infected erythrocytes (mean ± SEM, n = 3) recognized by mAbBC6 over 40 cycles of growth is indicated. In these six clones, not originally transcribing the type 41 var gene variant, the proportion of parasites recognized by mAbBC6 increases at a mean ron of 0.025% per generation. Symbols used are the same as for above.
Fig. 3.
Fig. 3.
Var transcript off-rates (roff) are fixed in P. falciparum.(A) Northern blot analysis of decreasing var transcript steady-state levels during 40 cycles of cell growth. Variant-specific probes to each of the predominant var transcribed (indicated by var type) in clones A–H hybridized. The hybridization signal from the control transcript EF-1α is shown as is the ethidium bromide-stained gel to indicate equal loading. The size of each transcript (kb) is indicated. (B) Analysis of the decrease in relative signal intensity for var in clones A–H. Log-transformed mean signal intensity (±SEM, n = 3) for the predominant transcript present in each clone at the start of the experiment is plotted over 40 cycles of cell growth. Clone A (var type 32, ▴, undetectably low roff), clones B and C (var type 6, ▾ and ▿, undetectably low roff), clones D and E (var type 14, • and ○, mean roff = 0.47 ± 0.04% per generation), clone F (var type 43, ▪, roff = 0.30% per generation), and clones G and H (var type 41, ♦ and ⋄, mean roff = 1.35 ± 0.12% per generation). (C) Flow cytometry analysis of type 41 var-encoded PfEMP1 molecule expression in clones G and H. The proportion of infected erythrocytes (mean ± SEM, n = 3) in each clone recognized by the var type 41 PfEMP1-specific mAbBC6 was log-transformed and plotted over 40 cycles of growth (mean type 41 PfEMP1 expression roff in clones G and H is 1.37 ± 0.07% per generation).
Fig. 4.
Fig. 4.
Three transcriptional states are proposed for var genes. The first two are transcriptionally active (A) and transcriptionally inactive (I), although the latter are still capable of being activated. The transition rates between the A and I states appear to be invariant among clones, suggesting they are intrinsic properties of each var gene variant. Var genes appear also to exist in a third highly silenced state (S). Irrespective of the rate of the I to A transition, these S-state var gene variants remain transcriptionally inactive within the limits of detection of this experiment. Data presented herein indicates that var transcriptional switching history may determine the S to I transition. The molecular mechanisms that mediate this highly silenced state remain unknown.

References

    1. Kyes, S., Horrocks, P. & Newbold, C. (2001) Annu. Rev. Microbiol. 55, 673–707. - PubMed
    1. Newbold, C. I. (1999) Curr. Opin. Microbiol. 2, 420–425. - PubMed
    1. Bull, P. C., Lowe, B. S., Kortok, M., Molyneux, C. S., Newbold, C. I. & Marsh, K. (1998) Nat. Med. 4, 358–360. - PMC - PubMed
    1. Baruch, D. I., Pasloske, B. L., Singh, H. B., Bi, X., Ma, X. C., Feldman, M., Taraschi, T. F. & Howard, R. J. (1995) Cell 82, 77–87. - PubMed
    1. Smith, J. D., Chitnis, C. E., Craig, A. G., Roberts, D. J., Hudson-Taylor, D. E., Peterson, D. S., Pinches, R., Newbold, C. I. & Miller, L. H. (1995) Cell 82, 101–110. - PMC - PubMed

Publication types

Substances