. 2004 Jul 27;101(30):10973-8.
doi: 10.1073/pnas.0401699101. Epub 2004 Jul 15.

A point mutation in the regulatory light chain reduces the step size of skeletal muscle myosin

Affiliations

A point mutation in the regulatory light chain reduces the step size of skeletal muscle myosin

Jennifer J Sherwood et al. Proc Natl Acad Sci U S A. .

Abstract

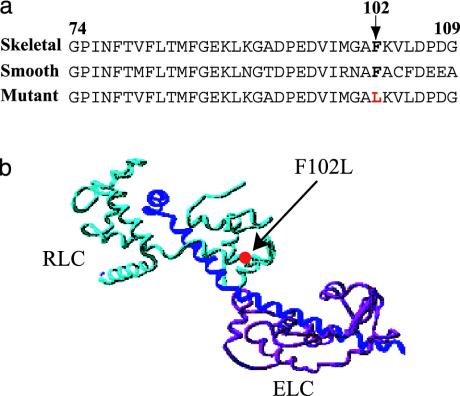
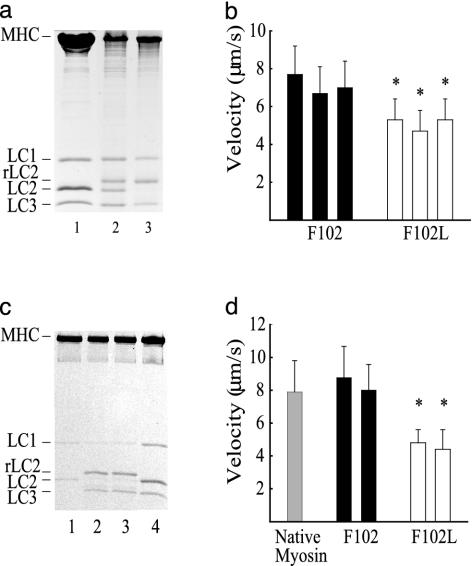
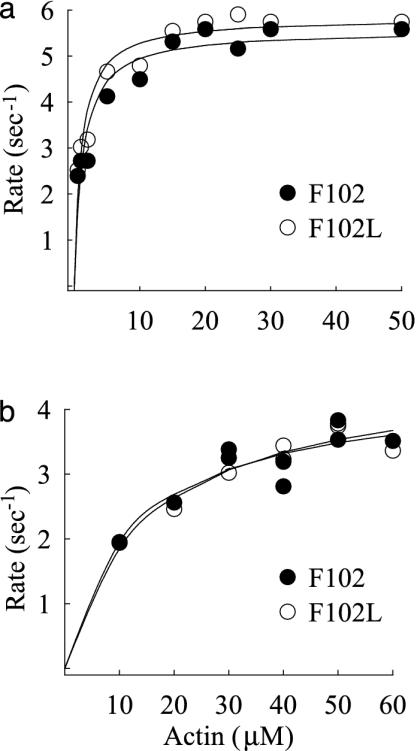
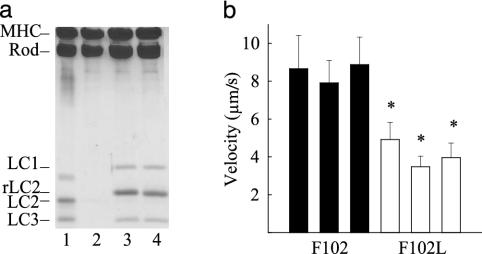
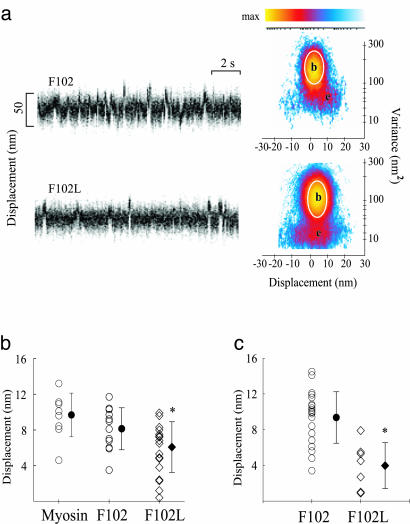
Current evidence favors the theory that, when the globular motor domain of myosin attaches to actin, the light chain binding domain or "lever arm" rotates, and thereby generates movement of actin filaments. Myosin is uniquely designed for such a role in that a long alpha-helix (approximately 9 nm) extending from the C terminus of the catalytic core is stabilized by two calmodulin-like molecules, the regulatory light chain (RLC) and the essential light chain (ELC). Here, we introduce a single-point mutation into the skeletal myosin RLC, which results in a large (approximately 50%) reduction in actin filament velocity (V(actin)) without any loss in actin-activated MgATPase activity. Single-molecule analysis of myosin by optical trapping showed a comparable 2-fold reduction in unitary displacement or step size (d), without a significant change in the duration of the strongly attached state (tau(on)) after the power stroke. Assuming that V(actin) approximately d/tau(on), we can account for the change in velocity primarily by a change in the step size of the lever arm without incurring any change in the kinetic properties of the mutant myosin. These results suggest that a principal role for the many light chain isoforms in the myosin II class may be to modulate the flexural rigidity of the light chain binding domain to maximize tension development and movement during muscle contraction.


Figures

Fig. 1.
Fig. 1.
Location of the chicken skeletal RLC mutation. (a) Amino acid sequence alignment of chicken skeletal, smooth muscle, and mutant skeletal RLCs. A conserved phenylalanine (F102) and F102L mutation (red) are shown in bold. (b) The F102L RLC mutation (red circle) mapped to the E-helix in the ribbon structure of the scallop myosin regulatory domain (27). ELC, magenta; RLC, light blue; heavy chain, dark blue.
Fig. 2.
Fig. 2.
Characterization of chicken pectoralis muscle myosin containing WT (F102) and mutant (F102L) RLCs. (a and b) Exchange of recombinant RLC (rLC2) into myosin. (a) Twelve percent SDS/PAGE of control myosin (lane 1), F102L (lane 2), and F102 (lane 3). (b) Corresponding actin filament velocities of myosin with F102 (filled bars) and F102L (open bars). Average velocity for myosin with WT (F102) (7.1 ± 1.3 μm/s, mean ± SD) and F102L RLCs (5.1 ± 1.1 μm/s). Values represent three independent preparations. (c and d) Myosin heavy chain reconstituted with light chains. (c) Light chain-deficient myosin (lane 1), myosin reconstituted with F102L and LC3 (lane 2) and F102 and LC3 (lane 3), and control chicken skeletal myosin (lane 4). (d) Velocity of native chicken skeletal myosin (gray bar) and myosin reconstituted with F102 (filled bar) or F102L (open bar). Average velocity for myosin with F102L (4.6 ± 0.8 μm/s, mean ± SD) and F102 (8.4 ± 1.9 μm/s). Values represent two independent preparations. *, Statistically significant from myosin with F102 RLC at the P < 0.001 level by Student's t test.
Fig. 3.
Fig. 3.
Actin-activated MgATPase activity for double-headed and single-headed myosins. (a) Myosin reconstituted with total light chains containing either F102 (filled circles) or F102L (open circles). Data were fit with a Michaelis–Menten equation to determine Vmax (≈5.6 s–1) and Km (1.2 μM). (b) Single-headed myosin with F102 or F102L, Vmax (≈ 4.4 s–1) and Km (≈13 μM). These values are all well within the range reported for filamentous native myosin at 25°C; single-headed subfragments typically have a higher Km than a double-headed species.
Fig. 4.
Fig. 4.
Characterization of single-headed chicken myosin reconstituted with F102 and F102L. (a) Twelve percent SDS/PAGE of single-headed (SH) myosin (lane 1), light chain-deficient SH-myosin (lane 2), and SH-myosin reconstituted with F102L (lane 3) and F102 (lane 4). Both ELC isoforms (LC1 and LC3) were included with the light chains. Papain digestion used to prepare single-headed myosin cleaves LC1 at the N terminus so that it migrates faster in the gel (lane 1). Note the two bands for MHC and rod, consistent with a single-headed species. (b) Average actin filament velocities for three different preparations of single-headed myosin with F102L (4.16 ± 0.75 μm/s, mean ± SD) compared with single-headed myosin with F102 (8.56 ± 1.5 μm/s). *, The difference between myosin with the F102 vs. F102L RLC was significant at the P < 0.001 level by Student's t test.
Fig. 5.
Fig. 5.
Single-molecule laser trap data from chicken skeletal myosin with F102 and F102L. (a) Representative data trace for F102 and F102L RLC-exchanged myosin. Myosin-binding events are characterized by a change in mean position associated with a reduction in variance. Shown are raw time traces (Left) and MV histograms (Right) representing myosin with F102 and F102L RLCs. MV histograms were calculated with a 20-ms time window by transforming the entire record (≅30–60 s) from which representative traces were taken. Note that the event population amplitudes, e, shown in the F102L histograms, are roughly half those of the F102 MV histogram. (b) Scatter plots representing the distributions of d produced by myosin, F102 RLC-exchanged myosin, and 60% F102L RLC-exchanged myosin. Mean values (filled symbols) and standard deviations are represented for each distribution. Values were obtained from three F102 (8.1 ± 2.4 nm) and F102L RLC-exchanged (6.1 ± 2.8 nm) myosin preparations. Each entry represents a fit from a single MV histogram, which may be comprised of 50–100 unitary events depending on the record duration and event density. (c) Scatter plots representing the distributions of d produced by myosin-reconstituted with total light chains. Mean values (filled symbols) ± SD are represented for each distribution. Values were obtained for two myosin preparations reconstituted with F102 (9.6 ± 2.7 nm) or F102L RLCs (3.8 ± 2.4 nm). *, The difference between myosin with the F102 vs. F102L RLC was significant at the P < 0.001 level by Student's t test.

References

    1. Rayment, I., Rypniewski, W. R., Schmidt-Base, K., Smith, R., Tomchick, D. R., Benning, M. M., Winkelmann, D. A., Wesenberg, G. & Holden, H. M. (1993) Science 261, 50–58. - PubMed
    1. Fisher, A. J., Smith, C. A., Thoden, J. B. Smith, R., Sutoh, K., Holden, H. M. & Rayment, I. (1995) Biochemistry 34, 8960–8972. - PubMed
    1. Dominguez, R., Freyzon, Y., Trybus, K. M. & Cohen, C. (1998) Cell 94, 559–571. - PubMed
    1. Rayment, I., Holden, H. M., Whittaker, M., Yohn, C. B., Lorenz, M., Holmes, K. C. & Milligan, R. A. (1993) Science 261, 58–65. - PubMed
    1. Whittaker, M., Wilson-Kubalek, E. M., Smith, J. E., Faust, L., Milligan, R. A. & Sweeney, H. L. (1995) Nature 378, 748–751. - PubMed

Publication types

LinkOut - more resources