A two-stage classifier for identification of protein-protein interface residues
- PMID: 15262822
- PMCID: PMC12453083
- DOI: 10.1093/bioinformatics/bth920
A two-stage classifier for identification of protein-protein interface residues
Abstract
Motivation: The ability to identify protein-protein interaction sites and to detect specific amino acid residues that contribute to the specificity and affinity of protein interactions has important implications for problems ranging from rational drug design to analysis of metabolic and signal transduction networks.
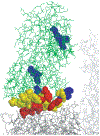
Results: We have developed a two-stage method consisting of a support vector machine (SVM) and a Bayesian classifier for predicting surface residues of a protein that participate in protein-protein interactions. This approach exploits the fact that interface residues tend to form clusters in the primary amino acid sequence. Our results show that the proposed two-stage classifier outperforms previously published sequence-based methods for predicting interface residues. We also present results obtained using the two-stage classifier on an independent test set of seven CAPRI (Critical Assessment of PRedicted Interactions) targets. The success of the predictions is validated by examining the predictions in the context of the three-dimensional structures of protein complexes.
Figures


References
-
- Baldi P, Brunak S, Chauvin Y and Andersen CAF (2000) Assessing the accuracy of prediction algorithms for classification: an overview. Bioinformatics, 16, 412–424. - PubMed
-
- Buntine W (1991) Theory refinement on Bayesian networks. Proceedings of Seventh Conference on Uncertainty in Artificial Intelligence. Morgan-Kaufmann, San Francisco, CA, USA. pp. 52–60.
-
- Chakrabarti P and Janin J (2002) Dissecting protein–protein recognition sites. J. Mol. Biol, 272, 132–143. - PubMed
-
- Chothia C and Janin J (1975) Principles of protein–protein recognition. Nature, 256, 705–708. - PubMed
-
- Eisenberg D, Schwarz E, Komaromy M and Wall R (1984) Analysis of membrane and surface protein sequences with the hydrophobic moment plot. J. Mol. Biol, 179, 125–142. - PubMed
Publication types
MeSH terms
Substances
Grants and funding
LinkOut - more resources
Full Text Sources

