. 2004 Aug;186(15):5017-30.
doi: 10.1128/JB.186.15.5017-5030.2004.

Induction of a novel class of diacylglycerol acyltransferases and triacylglycerol accumulation in Mycobacterium tuberculosis as it goes into a dormancy-like state in culture

Affiliations

Induction of a novel class of diacylglycerol acyltransferases and triacylglycerol accumulation in Mycobacterium tuberculosis as it goes into a dormancy-like state in culture

Jaiyanth Daniel et al. J Bacteriol. 2004 Aug.

Abstract

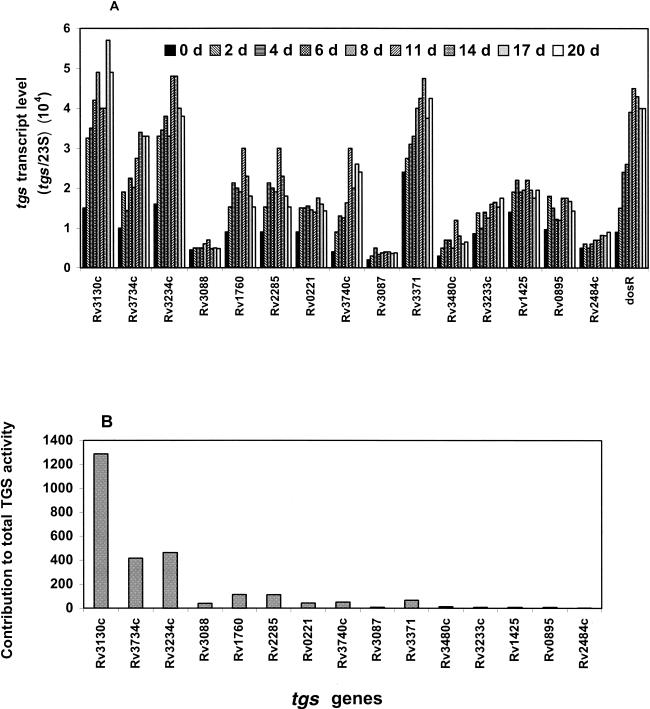
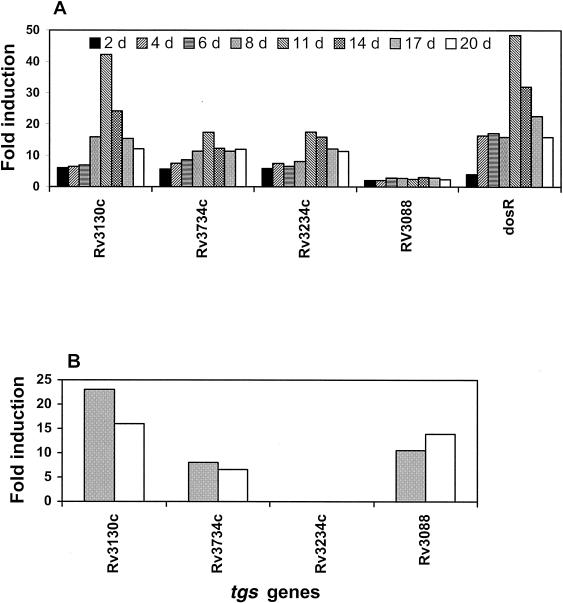
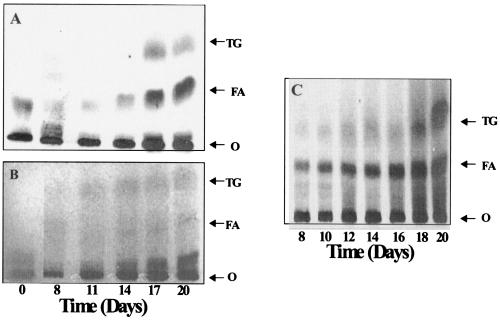
Mycobacterium tuberculosis enters the host by inhalation of an infectious aerosol and replicates in the alveolar macrophages until the host's immune defense causes bacteriostasis, which leads the pathogen to go into nonreplicative drug-resistant dormancy. The dormant pathogen can survive for decades till the host's immune system is weakened and active tuberculosis develops. Even though fatty acids are thought to be the major energy source required for the persistence phase, the source of fatty acids used is not known. We postulate that the pathogen uses triacylglycerol (TG) as a storage form of fatty acids. Little is known about the biosynthesis of TG in M. tuberculosis. We show that 15 mycobacterial genes that we identified as putative triacylglycerol synthase (tgs) when expressed in Escherichia coli showed TGS activity, and we report some basic catalytic characteristics of the most active enzymes. We show that several tgs genes are induced when the pathogen goes into the nonreplicative drug-resistant state caused by slow withdrawal of O(2) and also by NO treatment, which is known to induce dormancy-associated genes. The gene (Rv3130c) that shows the highest TGS activity when expressed in E. coli shows the highest induction by hypoxia and NO treatment. Biochemical evidence shows that TG synthesis and accumulation occur under both conditions. We conclude that TG may be a form of energy storage for use during long-term dormancy. Therefore, TG synthesis may be an appropriate target for novel antilatency drugs that can prevent the organism from surviving dormancy and thus assist in the control of tuberculosis.


Figures

FIG. 1.
FIG. 1.
(A) RT-PCR assessment of induction of tgs genes in M. tuberculosis H37Rv during the gradual depletion of O2. Transcript levels measured by RT-PCR are shown as a fraction of 23S rRNA transcripts. The method used for quantitation and experimental details are given in Materials and Methods. Each bar represents the induction level at a different sampling day as shown on the top of the graph. The induction level of dosR (Rv3133c) is shown for comparison. Since in the different experiments the initial cell density was slightly different, we did not average the values; instead, we represent a typical experiment. The same pattern was observed in the individual experiments. (B) Estimated potential relative contribution of the tgs gene products to the total TGS activity. The maximal level of each tgs transcript achieved during hypoxia was multiplied by the TGS activity of each expressed enzyme.
FIG. 2.
FIG. 2.
(A) Real-time PCR measurement of the most highly induced tgs genes in M. tuberculosis H37Rv during the gradual depletion of O2. Transcript levels were measured by real-time PCR, and data were analyzed by comparative CT method (ΔΔCT) for relative quantitation of gene expression. The induction level of dosR (Rv3133c) is shown for comparison. (B) Real-time PCR measurement of the most highly induced tgs genes in M. tuberculosis H37Rv by NO treatment. Quantitation of transcript levels was done by real-time PCR, and data were analyzed as for panel A but using the spermine control as the reference. The maximal level was reached within 4 h of the first NO treatment (gray bars) and within 4 h of the second NO treatment 16 hours after the initial NO treatment (open bar).
FIG. 3.
FIG. 3.
Induction of TG synthesis in M. tuberculosis during gradual depletion of O2. (A) Autoradiogram showing [1-14C]oleic acid incorporation into TG. (B and C) Dichromate-sulfuric acid charring of lipids showing TG accumulation in M. tuberculosis cells going into the nonreplicative state without exogenous oleic acid (B) and after 6 h of incubation with 0.64 μM oleic acid-0.5% BSA (C). Lipids were separated by TLC using n-hexane-ethyl ether-formic acid (45:5:1 [vol/vol/vol]) as the solvent system. O, origin; FA, fatty acids. Time after the initiation of O2 depletion is shown in days.
FIG. 4.
FIG. 4.
(A) Induction of tgs genes in M. tuberculosis H37Rv by NO treatment. Transcript levels were measured by RT-PCR and expressed as a fraction of the 23S rRNA transcript level. In each case the values obtained with the spermine control were subtracted, and the maximal level reached within 4 h after NO treatment is shown (gray bars). Sixteen hours after the initial NO treatment additional treatment with NO was done, and the maximal transcript levels reached within the next 4 h are shown (open bars). Induction level of dosR (Rv3133c) is shown for comparison. Since in the different experiments the initial cell density was slightly different, we did not average the values; instead, we represent a typical experiment. The same pattern was observed in the individual experiments. (B) Estimated potential relative contribution of the tgs gene products to the total TGS activity in M. tuberculosis cells. The maximal level of each tgs transcript achieved during the first 4 h of initial NO treatment was multiplied by the TGS activity of each expressed enzyme.
FIG. 5.
FIG. 5.
Induction of TG synthesis in M. tuberculosis by NO treatment. (A) Autoradiogram showing [1-14C]oleic acid incorporation into TG. (B) Dichromate-sulfuric acid charring of lipids showing TG accumulation. Lipids were separated by TLC using n-hexane-ethyl ether-formic acid (45:5:1 [vol/vol/vol]) as the solvent system. S, spermine control; N, NO treatment. Sixteen hours after the initial NO treatment additional treatment with NO was done, and samples were taken at 2 h (18B) and 4 h (20B) after the second NO treatment. In panel A, incorporation of 14C into TG is shown as a percentage of the total 14C administered. In panel B, the bar graph shows the intensity of the TG band determined in arbitrary units by the AlphaImager 2200 Gel Doc system. O, origin; FA, fatty acids.
FIG. 6.
FIG. 6.
Induction of TGS activity in cell extracts of M. tuberculosis cells after NO treatment. In each case, 200 μg of protein was assayed as indicated in Materials and Methods, and values obtained with spermine control cultures were subtracted. Sixteen hours after the initial NO treatment additional NO treatment was done, and samples were taken at 2 h (18B) and 4 h (20B) after the second NO treatment.
FIG. 7.
FIG. 7.
Radio-GC of fatty acids in TG derived from exogenous [1-14C]oleic acid in NO-treated M. tuberculosis. Methyl esters were prepared from [14C]TG from the 4-h sample after the second NO treatment 16 h after the initial NO treatment. The top panel shows the radioactivity detector response, and the lower panel shows the flame ionization detector (FID) response. Retention times of n-fatty acids are indicated above.
FIG. 8.
FIG. 8.
Autoradiogram showing induction of TG synthesis from 14C-labeled precursors by NO treatment in M. tuberculosis. After 4 h of NO treatment, cells were incubated with [1-14C]palmitic acid (for 1 h) and [1-14C]acetate (for 4 h), and the lipids were separated by TLC using n-hexane-ethyl ether-formic acid (45:5:1 [vol/vol/vol]) as the solvent system. S, spermine control; N, NO treatment. The bar graph shows the percentage of total administered radioactivity incorporation into TG. O, origin.
FIG. 9.
FIG. 9.
Radio-GCs of fatty acids from TG derived from [1-14C]acetate and [1-14C]palmitic acid in NO-treated M. tuberculosis. Methyl esters were prepared from [14C]TG isolated after incubation with 14C-labeled precursors at 4 h after the NO treatment. Retention times of n-fatty acids are indicated above.

References

    1. Alvarez, H. M., and A. Steinbuchel. 2002. Triacylglycerols in prokaryotic microorganisms. Appl. Microbiol. Biotechnol. 60:367-376. - PubMed
    1. Asselineau, C., J. Asselineau, G. Laneelle, and M. A. Laneelle. 2002. The biosynthesis of mycolic acids by mycobacteria: current and alternative hypotheses. Prog. Lipid Res. 41:501-523. - PubMed
    1. Betts, J. C., P. T. Lukey, L. C. Robb, R. A. McAdam, and K. Duncan. 2002. Evaluation of a nutrient starvation model of Mycobacterium tuberculosis persistence by gene and protein expression profiling. Mol. Microbiol. 43:717-731. - PubMed
    1. Bishai, W. 2000. Lipid lunch for persistent pathogen. Nature 406:683-685. - PubMed
    1. Boon, C., and T. Dick. 2002. Mycobacterium bovis BCG response regulator essential for hypoxic dormancy. J. Bacteriol. 184:6760-6767. - PMC - PubMed

Publication types

MeSH terms

LinkOut - more resources