. 2004 Jul 19;200(2):123-35.
doi: 10.1084/jem.20040440.

A new human somatic stem cell from placental cord blood with intrinsic pluripotent differentiation potential

Affiliations

A new human somatic stem cell from placental cord blood with intrinsic pluripotent differentiation potential

Gesine Kögler et al. J Exp Med. .

Abstract

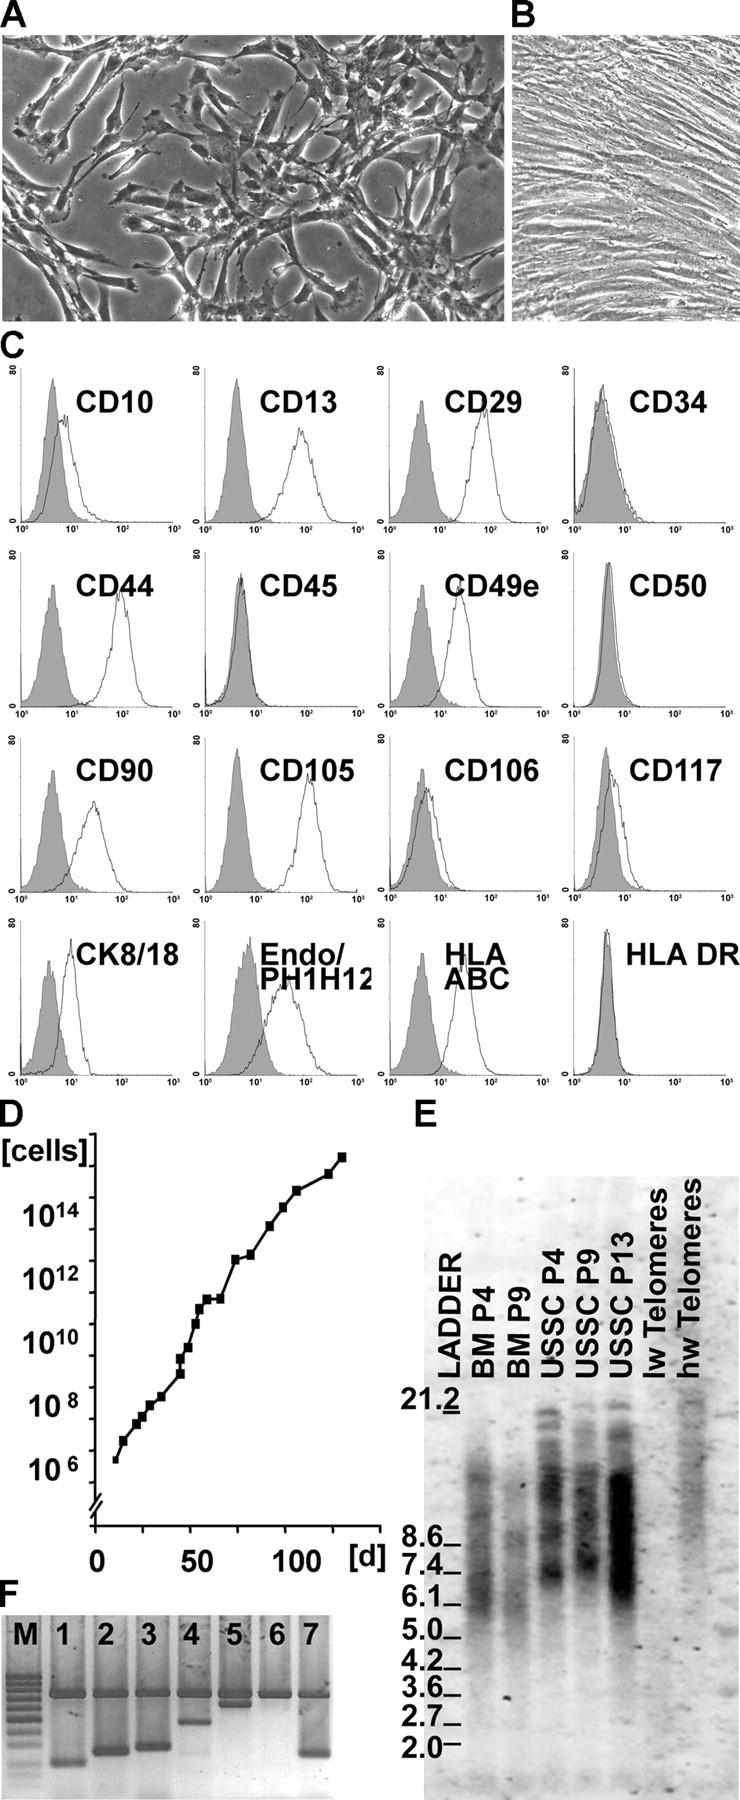
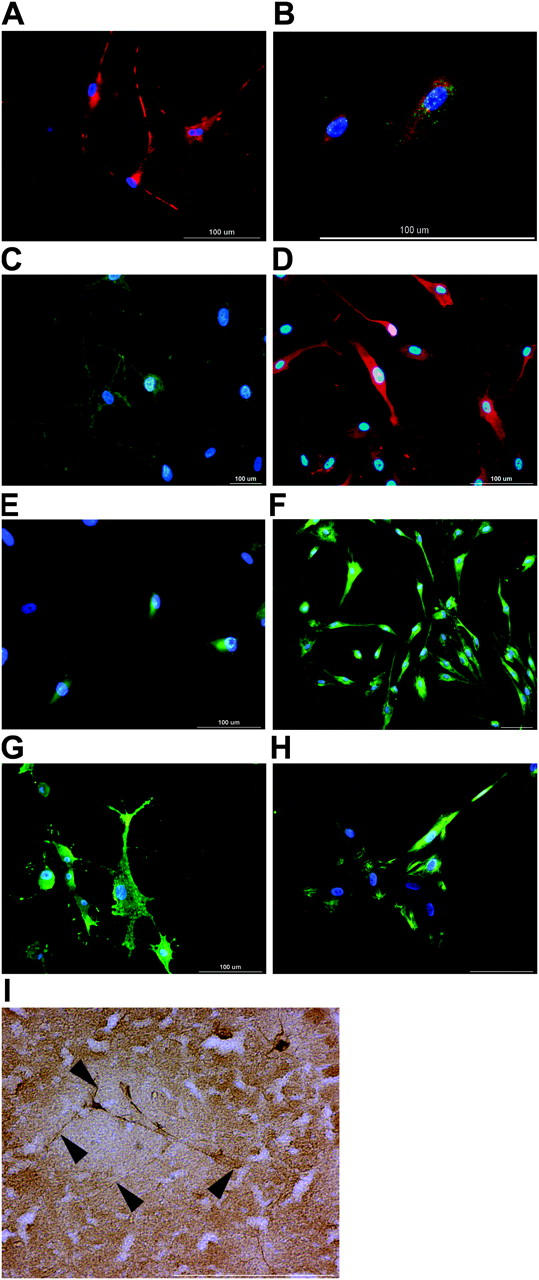
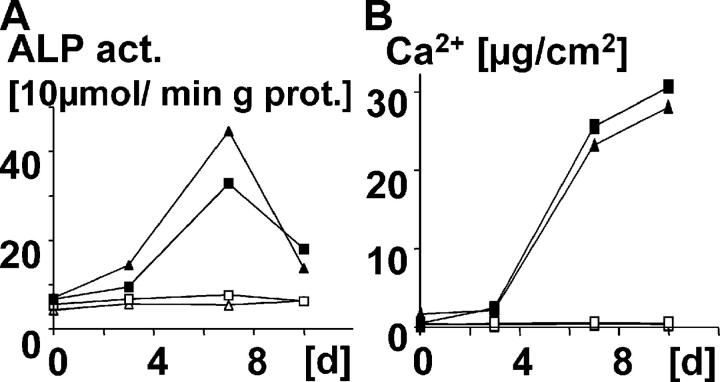
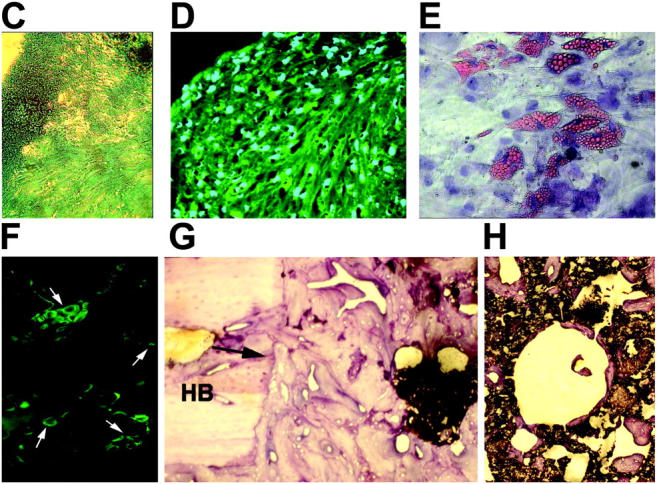
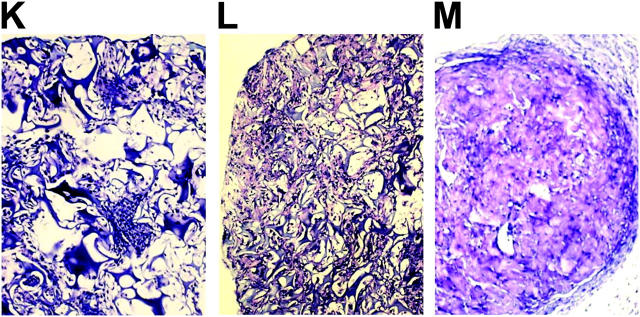
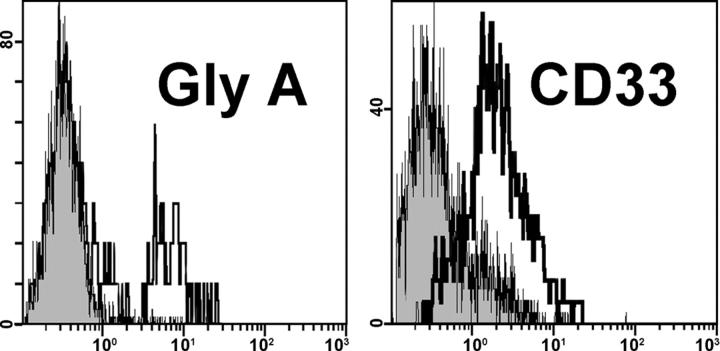
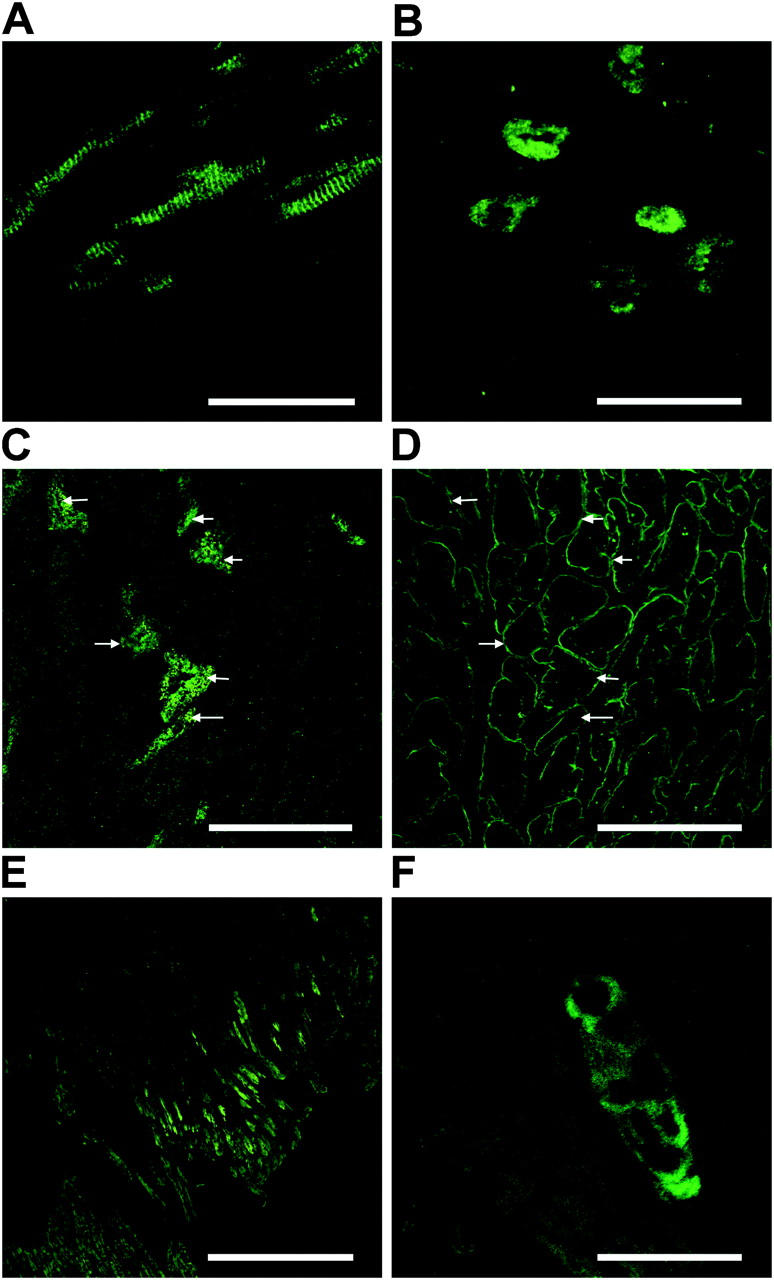
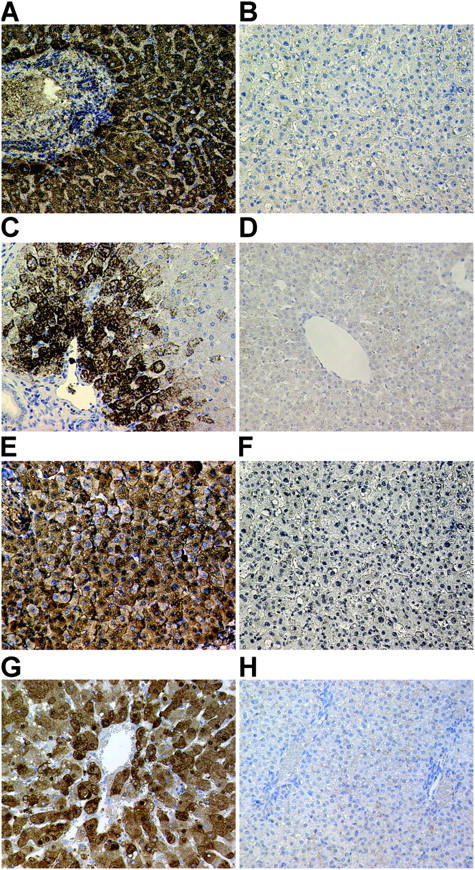
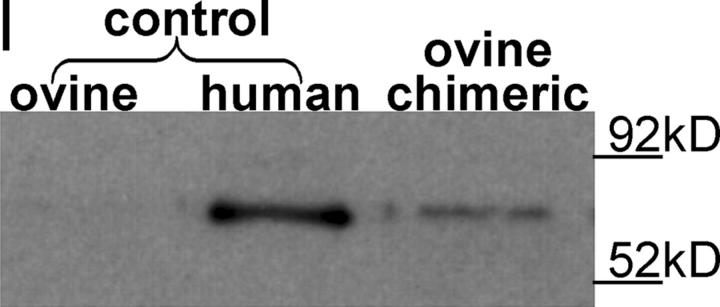
Here a new, intrinsically pluripotent, CD45-negative population from human cord blood, termed unrestricted somatic stem cells (USSCs) is described. This rare population grows adherently and can be expanded to 10(15) cells without losing pluripotency. In vitro USSCs showed homogeneous differentiation into osteoblasts, chondroblasts, adipocytes, and hematopoietic and neural cells including astrocytes and neurons that express neurofilament, sodium channel protein, and various neurotransmitter phenotypes. Stereotactic implantation of USSCs into intact adult rat brain revealed that human Tau-positive cells persisted for up to 3 mo and showed migratory activity and a typical neuron-like morphology. In vivo differentiation of USSCs along mesodermal and endodermal pathways was demonstrated in animal models. Bony reconstitution was observed after transplantation of USSC-loaded calcium phosphate cylinders in nude rat femurs. Chondrogenesis occurred after transplanting cell-loaded gelfoam sponges into nude mice. Transplantation of USSCs in a noninjury model, the preimmune fetal sheep, resulted in up to 5% human hematopoietic engraftment. More than 20% albumin-producing human parenchymal hepatic cells with absence of cell fusion and substantial numbers of human cardiomyocytes in both atria and ventricles of the sheep heart were detected many months after USSC transplantation. No tumor formation was observed in any of these animals.


Figures

Figure 1.
Figure 1.
Characteristics of USSCs. (A) Spindle-shaped USSCs plated at low density after 32 population doublings (×20 magnification). (B) USSCs plated at high density after 24 population doublings (×20 magnification). (C) Immunophenotype of USSCs. Cells were labeled with the mAb specific for the molecules indicated (open histograms) or isotype controls (filled histograms). (D) Expansion kinetics of USSCs for 20 passages (p) equivalent to 46 population doublings (pd). (E) Expanded USSCs from CB have longer telomeres than MSCs from BM. Lane 1, ladder; lane 2, MSCs from BM, 19 pd (p4); lane 3, MSCs from BM, 27 pd (p9); lane 4, USSCs from CB, 21 pd (p4), lane 5, USSCs from CB, 25 pd (p9); lane 6, USSCs from CB, 36 pd (p13); lane 7 and 8, controls. Low weight (lw) and high weight (hw) telomeres were used according to manufacturer's instructions. (F) RT-PCR from undifferentiated USSCs: lane1, EGFR (205 bp); lane 2, IGFR (272 bp); lane 3, RUNX1 (296 bp); lane 4, CD105 (499 bp); lane 5, CD49e (640 bp); lane 6, CHAD (513 bp); lane 7, PDGFRa (251 bp). All reactions were coamplified with GAPDH (755 bp) as an internal positive control. All of these genes were expressed except for chondroadherin.
Figure 2.
Figure 2.
In vitro and in vivo differentiation of USSCs into neural cells. In XXL, medium differentiated cells showed positive immunoreactivity for the neuron-specific marker NF (A), voltage-gated sodium channels (green) coexpressed with NF (red) (B) for synaptophysin, a protein located in the synaptic vesicles of neurons (C), the inhibitory neurotransmitter GABA (D), the enzymes TH (E), DOPA-decarboxylase (F), and choline acetyltransferase, the enzyme of the cholinergic pathway (G), and the astrocyte-specific marker GFAP (H). Cell nuclei show a blue color due to DAPI staining. USSCs staining positively for hTau in the ipsilateral cortex 3 mo after stereotactic implantation into the hippocampus region (I). Note the long processes (indicated by arrowheads) and the highly differentiated neuronal like morphology. Bars, 100 μm.
Figure 3.
Figure 3.
In vitro and in vivo differentiation of USSCs into osteoblasts, chondroblasts, and adipocytes. (A) Differentiation to osteoblasts is shown by the ALP assay. The peak of ALP was already achieved on day 7. Both basic media McCoy (filled square) and DMEM (filled triangle) in the presence of DAG were able to support the osteoblast differentiation. USSCs (control: open triangle, DMEM; open square, McCoy) cultured without DAG showed no ALP activity. (B) Quantitative Ca2+ release assay. Both basic media McCoy (filled square) and DMEM in the presence of DAG (filled triangle) were able to support the osteoblast differentiation. USSCs (control: open triangle: DMEM; open square, McCoy) cultured without DAG showed no Ca2+ activity. (C and D) Chondrogenic differentiation. (C) Demonstrates an Alcian blue–positive extracellular matrix at day 21 after stimulation toward the chondrogenic pathway, indicating a homogeneous distribution of sulfated proteoglycans within the matrix structure (×10 magnification). (D) Collagen type II staining of pellet microsections analyzed by fluorescence microscopy; the nuclei are stained with DAPI (×40 magnification). (E) Oil Red-O staining of the lipid vesicles performed 2 wk after stimulation demonstrates an ongoing adipogenesis (×40 magnification). In vivo differentiation of USSCs into bone and cartilage. (F–M) Ceramic cylinders were loaded with USSCs and transplanted into nude rat femur critical size defects of 0.5 cm in length. (F) 4 wk after transplantation, human cells were still present in the bone defect as demonstrated by immunohistochemical staining with the human-specific mAb 6E2 (×20 magnification). (G and H) Images of the longitudinal (G) and cross section (H) demonstrate bony healing between the cell-loaded implant and the host bone (HB). Bony integration was established in forms of cancellous bone as detected by Toluidine blue staining (×4 magnification). (I) Faxitron high resolution x-ray scanning of specimens harvested at 12 wk after surgery demonstrates the healing between the cell-loaded implant and the host bone (magnification, original size). (J) Unloaded ceramic cylinders served as negative controls demonstrating a nonhealing between the scaffold and the host bone. Arrows indicate the interface between the scaffold and the host bone (magnification, original size). (K–M) A successful in vivo chondrogenesis of USSC-loaded Gelfoam sponges in a nude mouse model. Human USSCs loaded into gelatin sponges were cultured in vitro for 1 (K) or 2 (L) wk in a chondrogenic medium with TGF-β. These sponges were s.c. implanted into nude mice for another 3 wk before analysis. At 1 (K) or 2 (L) wk of in vitro culture, cells filled the pores of the Gelfoam sponge. Some local spots demonstrate an extracellular matrix formation which indicate chondrogenic lineage differentiation. The implanted cells demonstrate strong chondrogenic differentiation as documented by Toluidine blue staining (M) (×10 magnification).
Figure 3.
Figure 3.
In vitro and in vivo differentiation of USSCs into osteoblasts, chondroblasts, and adipocytes. (A) Differentiation to osteoblasts is shown by the ALP assay. The peak of ALP was already achieved on day 7. Both basic media McCoy (filled square) and DMEM (filled triangle) in the presence of DAG were able to support the osteoblast differentiation. USSCs (control: open triangle, DMEM; open square, McCoy) cultured without DAG showed no ALP activity. (B) Quantitative Ca2+ release assay. Both basic media McCoy (filled square) and DMEM in the presence of DAG (filled triangle) were able to support the osteoblast differentiation. USSCs (control: open triangle: DMEM; open square, McCoy) cultured without DAG showed no Ca2+ activity. (C and D) Chondrogenic differentiation. (C) Demonstrates an Alcian blue–positive extracellular matrix at day 21 after stimulation toward the chondrogenic pathway, indicating a homogeneous distribution of sulfated proteoglycans within the matrix structure (×10 magnification). (D) Collagen type II staining of pellet microsections analyzed by fluorescence microscopy; the nuclei are stained with DAPI (×40 magnification). (E) Oil Red-O staining of the lipid vesicles performed 2 wk after stimulation demonstrates an ongoing adipogenesis (×40 magnification). In vivo differentiation of USSCs into bone and cartilage. (F–M) Ceramic cylinders were loaded with USSCs and transplanted into nude rat femur critical size defects of 0.5 cm in length. (F) 4 wk after transplantation, human cells were still present in the bone defect as demonstrated by immunohistochemical staining with the human-specific mAb 6E2 (×20 magnification). (G and H) Images of the longitudinal (G) and cross section (H) demonstrate bony healing between the cell-loaded implant and the host bone (HB). Bony integration was established in forms of cancellous bone as detected by Toluidine blue staining (×4 magnification). (I) Faxitron high resolution x-ray scanning of specimens harvested at 12 wk after surgery demonstrates the healing between the cell-loaded implant and the host bone (magnification, original size). (J) Unloaded ceramic cylinders served as negative controls demonstrating a nonhealing between the scaffold and the host bone. Arrows indicate the interface between the scaffold and the host bone (magnification, original size). (K–M) A successful in vivo chondrogenesis of USSC-loaded Gelfoam sponges in a nude mouse model. Human USSCs loaded into gelatin sponges were cultured in vitro for 1 (K) or 2 (L) wk in a chondrogenic medium with TGF-β. These sponges were s.c. implanted into nude mice for another 3 wk before analysis. At 1 (K) or 2 (L) wk of in vitro culture, cells filled the pores of the Gelfoam sponge. Some local spots demonstrate an extracellular matrix formation which indicate chondrogenic lineage differentiation. The implanted cells demonstrate strong chondrogenic differentiation as documented by Toluidine blue staining (M) (×10 magnification).
Figure 4.
Figure 4.
In vitro hematopoiesis of USSCs. Glycophorin A (PE-conjugated Ab) staining of the colonies for confirmation of erythroid progenitor cells and CD33 staining (FITC-conjugated Ab) of the colonies for the detection of myeloid progenitor cells. mAb specific for the molecule indicated (open histograms) or isotype controls (filled histograms).
Figure 5.
Figure 5.
In vivo differentiation of USSCs to cardiomyocytes and Purkinje fibers. (A and B) Groups of engrafted cells in the right atria in a longitudinal section (A) and from the right ventricle in a cross section (B) stained with human-specific anti-HSP27. (C and D) Serial sections of the right ventricle. C is labeled with a human-specific anti-HSP27 mAb, and D is labeled with an antidystrophin mAb with broad species specificity. Arrows indicate the same cells. (E) An area from the left ventricle showing areas of engrafted human cells surrounded by sheep cells. (F) A section of Purkinje fiber labeled with the human-specific anti-HSP27. Bars: (A–E) 50 μm; (F) 100 μm.
Figure 6.
Figure 6.
In vivo differentiation of USSCs from CB into parenchymal liver cells in the preimmune fetal sheep model. (A) Positive control: human liver stained with the anti–human hepatocyte Ab. The specificity for parenchymal liver cells is shown, since fibroblasts and endothelial cells in association with the portal spaces are negative. (B) Negative control: human liver stained with only the second Ab; no reaction or unspecific staining was observed. (C) Photomicrographs show the staining for the anti–human hepatocyte Ab in liver sections of animals transplanted with USSCs; in close association with the portal veins >80% of cells stained positive. No vessels are stained. (D) Negative control: the liver of a normal sheep shows no reaction with the Ab specific for human hepatocytes (A–D, × 20 magnification). (E–H) The anti–human albumin staining of the liver. E is the positive control: the human liver stained positive with the mAb HSA-11. (F) The human liver stained with only the second Ab: no reaction or unspecific staining was observed. (G) The staining of the anti–human albumin Ab in liver sections of animals transplanted with USSCs. (H) Liver of a normal sheep showed no reaction with the human albumin. (E–H, ×20 magnification). (I) Western blot of human albumin in human serum and serum of chimeric and control sheep. A representative Western blot is shown.
Figure 6.
Figure 6.
In vivo differentiation of USSCs from CB into parenchymal liver cells in the preimmune fetal sheep model. (A) Positive control: human liver stained with the anti–human hepatocyte Ab. The specificity for parenchymal liver cells is shown, since fibroblasts and endothelial cells in association with the portal spaces are negative. (B) Negative control: human liver stained with only the second Ab; no reaction or unspecific staining was observed. (C) Photomicrographs show the staining for the anti–human hepatocyte Ab in liver sections of animals transplanted with USSCs; in close association with the portal veins >80% of cells stained positive. No vessels are stained. (D) Negative control: the liver of a normal sheep shows no reaction with the Ab specific for human hepatocytes (A–D, × 20 magnification). (E–H) The anti–human albumin staining of the liver. E is the positive control: the human liver stained positive with the mAb HSA-11. (F) The human liver stained with only the second Ab: no reaction or unspecific staining was observed. (G) The staining of the anti–human albumin Ab in liver sections of animals transplanted with USSCs. (H) Liver of a normal sheep showed no reaction with the human albumin. (E–H, ×20 magnification). (I) Western blot of human albumin in human serum and serum of chimeric and control sheep. A representative Western blot is shown.

Similar articles

Cited by

References

    1. Kuehnle, I., and M.A. Goodell. 2002. The therapeutic potential of stem cells from adults. BMJ. 325:372–376. - PMC - PubMed
    1. Thomson, J.A., J. Itskovitz-Eldor, S.S. Shapiro, M.A. Waknitz, J.J. Swiergiel, V.S. Marshall, and J.M. Jones. 1998. Embryonic stem cell lines derived from human blastocysts. Science. 282:1145–1147. - PubMed
    1. Erdo, F., C. Buhrle, J. Blunk, M. Hoehn, Y. Xia, B. Fleischmann, M. Focking, E. Kustermann, E. Kolossov, J. Hescheler, et al. 2003. Host-dependent tumorigenesis of embryonic stem cell transplantation in experimental stroke. J. Cereb. Blood Flow Metab. 23:780–785. - PubMed
    1. Sapienza, C. 2002. Imprinted gene expression, transplantation medicine, and the “other” human embryonic stem cell. Proc. Natl. Acad. Sci. USA. 99:10243–10245. - PMC - PubMed
    1. Gussoni, E., Y. Soneoka, C.D. Strickland, E.A. Buzney, M.K. Khan, A.F. Flint, L.M. Kunkel, and R.C. Mulligan. 1999. Dystrophin expression in the mdx mouse restored by stem cell transplantation. Nature. 401:390–394. - PubMed

Publication types

MeSH terms