

Heteronuclear NMR investigations of dynamic regions of intact Escherichia coli ribosomes
- PMID: 15263071
- PMCID: PMC503724
- DOI: 10.1073/pnas.0400928101
Heteronuclear NMR investigations of dynamic regions of intact Escherichia coli ribosomes
Abstract
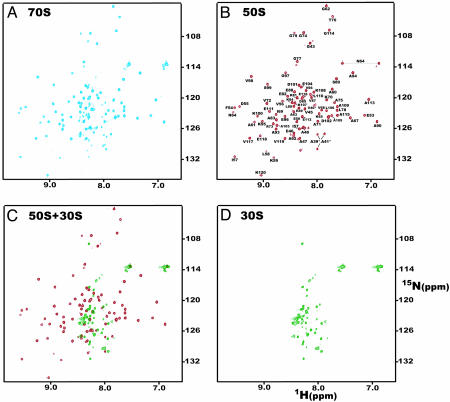
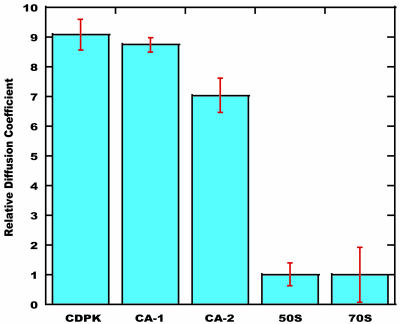
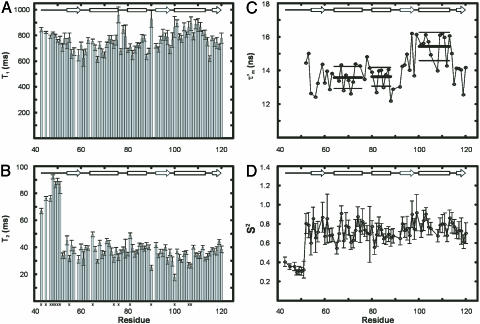
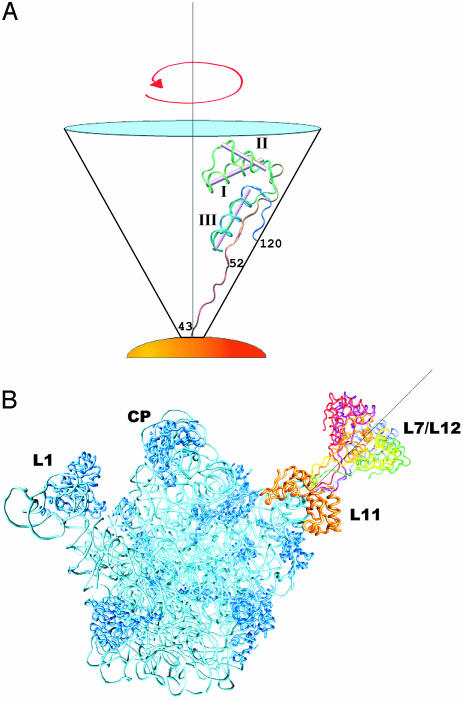
15N-(1)H NMR spectroscopy has been used to probe the dynamic properties of uniformly (15)N labeled Escherichia coli ribosomes. Despite the high molecular weight of the complex ( approximately 2.3 MDa), [(1)H-(15)N] heteronuclear single-quantum correlation spectra contain approximately 100 well resolved resonances, the majority of which arise from two of the four C-terminal domains of the stalk proteins, L7/L12. Heteronuclear pulse-field gradient NMR experiments show that the resonances arise from species with a translational diffusion constant consistent with that of the intact ribosome. Longitudinal relaxation time (T(1)) and T(1 rho) (15)N-spin relaxation measurements show that the observable domains tumble anisotropically, with an apparent rotational correlation time significantly longer than that expected for a free L7/L12 domain but much shorter than expected for a protein rigidly incorporated within the ribosomal particle. The relaxation data allow the ribosomally bound C-terminal domains to be oriented relative to the rotational diffusion tensor. Binding of elongation factor G to the ribosome results in the disappearance of the resonances of the L7/L12 domains, indicating a dramatic reduction in their mobility. This result is in agreement with cryoelectron microscopy studies showing that the ribosomal stalk assumes a single rigid orientation upon elongation factor G binding. As well as providing information about the dynamical properties of L7/L12, these results demonstrate the utility of heteronuclear NMR in the study of mobile regions of large biological complexes and form the basis for further NMR studies of functional ribosomal complexes in the context of protein synthesis.
Figures
Similar articles
-
Acetylation of L12 increases interactions in the Escherichia coli ribosomal stalk complex.J Mol Biol. 2008 Jul 4;380(2):404-14. doi: 10.1016/j.jmb.2008.04.067. Epub 2008 May 3. J Mol Biol. 2008. PMID: 18514735
-
Mechanism and rates of exchange of L7/L12 between ribosomes and the effects of binding EF-G.ACS Chem Biol. 2012 Jun 15;7(6):1120-7. doi: 10.1021/cb300081s. Epub 2012 Apr 18. ACS Chem Biol. 2012. PMID: 22489843 Free PMC article.
-
Nuclear magnetic resonance techniques for studying structure and function of ribosomes.Methods Enzymol. 1988;164:148-58. doi: 10.1016/s0076-6879(88)64040-7. Methods Enzymol. 1988. PMID: 3071659
-
The L7/L12 ribosomal domain of the ribosome: structural and functional studies.FEBS Lett. 1997 May 5;407(3):253-6. doi: 10.1016/s0014-5793(97)00361-x. FEBS Lett. 1997. PMID: 9175862 Review.
-
The enigmatic ribosomal stalk.Q Rev Biophys. 2018 Jan;51:e12. doi: 10.1017/S0033583518000100. Q Rev Biophys. 2018. PMID: 30912488 Review.
Cited by
-
Projected [(1)H, (15)N]-HMQC-[ (1)H, (1)H]-NOESY for large molecular systems: application to a 121 kDa protein-DNA complex.J Biomol NMR. 2008 Mar;40(3):175-81. doi: 10.1007/s10858-008-9219-5. Epub 2008 Jan 30. J Biomol NMR. 2008. PMID: 18231863
-
A strategy for co-translational folding studies of ribosome-bound nascent chain complexes using NMR spectroscopy.Nat Protoc. 2016 Aug;11(8):1492-507. doi: 10.1038/nprot.2016.101. Epub 2016 Jul 28. Nat Protoc. 2016. PMID: 27466710
-
Protein structure determination from NMR chemical shifts.Proc Natl Acad Sci U S A. 2007 Jun 5;104(23):9615-20. doi: 10.1073/pnas.0610313104. Epub 2007 May 29. Proc Natl Acad Sci U S A. 2007. PMID: 17535901 Free PMC article.
-
Selective detection of peptide-oligonucleotide heteroconjugates utilizing capillary HPLC-ICPMS.J Am Soc Mass Spectrom. 2012 Jun;23(6):1053-61. doi: 10.1007/s13361-012-0366-2. Epub 2012 Mar 27. J Am Soc Mass Spectrom. 2012. PMID: 22451333 Free PMC article.
-
A structural ensemble of a ribosome-nascent chain complex during cotranslational protein folding.Nat Struct Mol Biol. 2016 Apr;23(4):278-285. doi: 10.1038/nsmb.3182. Epub 2016 Feb 29. Nat Struct Mol Biol. 2016. PMID: 26926436 Free PMC article.
References
-
- Moore, P. B. & Steitz, T. A. (2003) Annu. Rev. Biochem. 72, 813–850. - PubMed
-
- Wilson, D. N. & Nierhaus, K. H. (2003) Angew. Chem. Int. Ed. Engl. 42, 3464–3486. - PubMed
-
- Ban, N., Nissen, P., Hansen, J., Moore, P. B. & Steitz, T. A. (2000) Science 289, 905–920. - PubMed
-
- Harms, J., Schluenzen, F., Zarivach, R., Bashan, A., Gat, S., Agmon, I., Bartels, H., Franceschi, F. & Yonath, A. (2001) Cell 107, 679–688. - PubMed
-
- Frank, J. (2000) Chem. Biol. 7, R133–R141. - PubMed
Publication types
MeSH terms
Substances
LinkOut - more resources
Full Text Sources
Research Materials
