. 2004 Jul 27;101(30):11159-64.
doi: 10.1073/pnas.0402026101. Epub 2004 Jul 19.

Evidence for defective energy homeostasis in amyotrophic lateral sclerosis: benefit of a high-energy diet in a transgenic mouse model

Affiliations

Evidence for defective energy homeostasis in amyotrophic lateral sclerosis: benefit of a high-energy diet in a transgenic mouse model

Luc Dupuis et al. Proc Natl Acad Sci U S A. .

Abstract

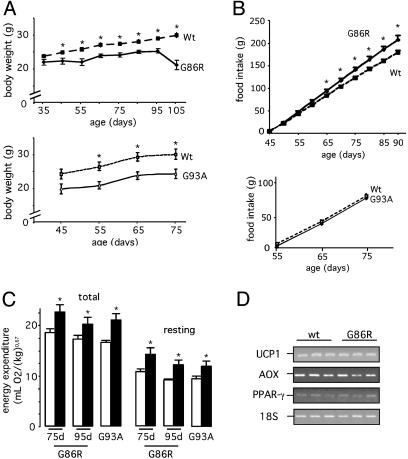
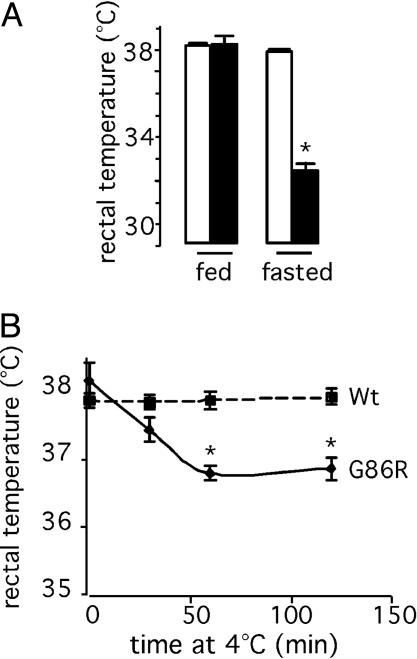
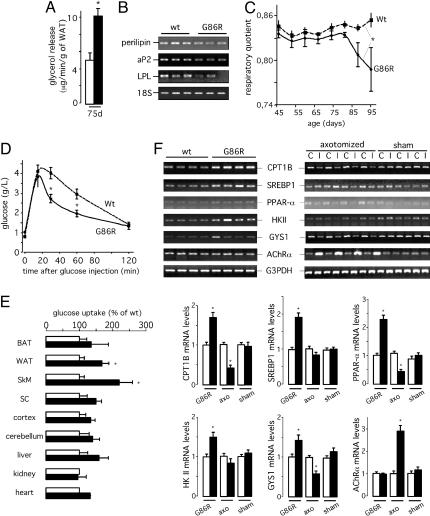
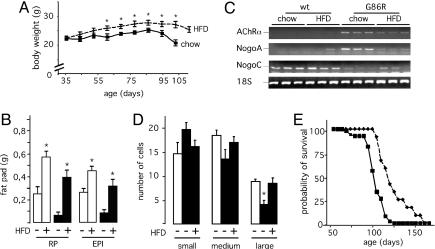
Amyotrophic lateral sclerosis (ALS) is an adult-onset neurodegenerative disease characterized by selective loss of motor neurons and progressive muscle wasting. Growing evidence indicates that mitochondrial dysfunction, not only occurring in motor neurons but also in skeletal muscle, may play a crucial role in the pathogenesis. In this regard, the life expectancy of the ALS G93A mouse line is extended by creatine, an intracellular energy shuttle that ameliorates muscle function. Moreover, a population of patients with sporadic ALS exhibits a generalized hypermetabolic state of as yet unknown origin. Altogether, these findings led us to explore whether alterations in energy homeostasis may contribute to the disease process. Here, we show important variations in a number of metabolic indicators in transgenic ALS mice, which in all shows a metabolic deficit. These alterations were accompanied early in the asymptomatic phase of the disease by reduced adipose tissue accumulation, increased energy expenditure, and concomitant skeletal muscle hypermetabolism. Compensating this energetic imbalance with a highly energetic diet extended mean survival by 20%. In conclusion, we suggest that hypermetabolism, mainly of muscular origin, may represent by itself an additional driven force involved in increasing motor neuron vulnerability.


Figures

Fig. 1.
Fig. 1.
Mutant SOD1 mice exhibit an altered metabolic status. (A) Typical curves showing the body mass of G86R (Upper) and G93A (Lower) mice, and their corresponding WT littermates. *, P < 0.05 vs. WT (n = 7). (B) Food intake in the same animals as in A. *, P < 0.05 vs. WT (n = 7). (C) Total (Left) and resting (Right) energy expenditure in G86R mice (75 and 95 days old; filled bars), G93A (75 days old; filled bars), and their corresponding WT littermates (open bars). *, P < 0.05 vs. WT (n = 8). (D) Representative RT-PCR showing uncoupling protein-1 (UCP1), acetylCoA oxidase (AOX), and PPAR-γ mRNA levels in BAT from 75-day-old WT and G86R mice. Identical results were obtained in 105-day-old mice (data not shown).
Fig. 2.
Fig. 2.
Adaptative thermogenesis is compromised in G86R mice. Rectal temperature in 105-day-old WT (open bars) and G86R (filled bars) mice fasted for 24 h (A) or exposed to 4°C(B) is shown. *, P < 0.05 vs. WT (n = 8 for fasted; n = 7 for cold-exposed).
Fig. 3.
Fig. 3.
G86R mice exhibit increased lipolysis and skeletal muscle hypermetabolism. (A) Norepinephrine-stimulated glycerol release in epididymal WAT explants from 75-day-old WT (open bars) and G86R (filled bars) mice. *, P < 0.05 vs. WT (n = 5). (B) Representative RT-PCR showing perilipin, aP2, and lipoprotein lipase (LPL) mRNA levels in epididymal WAT from 75-day-old WT and G86R mice. (C) Respiratory quotient of WT and G86R mice. Paired t test; *, P < 0.05 vs. WT (n = 8). (D) Glucose tolerance test in overnight-fasted WT and G86R mice at 60–80 days of age after i.p. injection of 2 g/kg glucose at time 0. *, P < 0.05 vs. WT (n = 20). (E) Glucose uptake in tissues from 75-day-old WT (open bars) and G86R (filled bars) mice treated as in D in the presence of radiolabeled 2-deoxyglucose. Tissues included BAT, WAT, spinal cord (SC), hindlimb skeletal muscle (SkM), cortex, cerebellum, liver, kidney, and heart. Data are expressed as percentage relative to the corresponding WT tissue. *, P < 0.05 vs. WT (n = 6). (F)(Upper) Representative RT-PCR showing carnitine palmityl-transferase 1B (CPT1B), serum-response element binding protein 1c (SREBP1), PPAR-α, hexokinase II (HKII), and glycogen synthase 1 (GYS1) mRNA levels in hindlimb skeletal muscle from 75-day-old WT and G86R (Left) and sciatic nerve axotomized (axo) (Right) mice. The expression levels in the skeletal muscle ipsi-(I) and contralateral (C) to the lesion are shown. Sham-operated animals (sham) served as control. The degree of denervation in G86R and axotomized mice was assessed by monitoring the mRNA levels of AChRα. (Lower) The quantitative analysis of the data in WT or contralateral (open bars) and G86R or ipsilateral hindlimb skeletal muscle (filled bars). *, P < 0.05 vs. WT or contralateral (n = 4 for G86R; n = 5 for axo).
Fig. 4.
Fig. 4.
HFD improves the altered metabolic phenotype of G86R mice and delays disease onset. (A) Typical curves showing the body weight of G86R mice fed a regular diet (chow) or HFD. Similar increases in body weight were observed in WT animals fed HFD (data not shown). *, P < 0.05 vs. chow (n = 12 for chow; n = 13 for HFD). (B) Mass of retroperitoneal (RP) and epididymal WAT (EPI) of WT (open bars) and G86R (filled bars) mice fed as in A. Animals were killed at 90 days of age before the onset of any motor symptoms, and white fat pads were dissected and weighed. *, P < 0.05 vs. HFD–(n = 6). (C) Representative RT-PCR showing AChRα, Nogo-A, and Nogo-C mRNA levels in hindlimb skeletal muscle from WT and G86R mice fed as in A and killed at 90 days of age. (D) Cell counts in the ventral horns of the lumbar spinal cord of WT (open bars) and G86R (filled bars) mice fed a regular chow diet (–) or HFD (+). Cells were classified into three area groups of <300 μm2 (small), between 300 and 600 μm2 (medium), and >600 μm2 (large). *, P < 0.05 vs. HFD+ or WT (n = 21); ANOVA followed by Newman–Keuls test. (E) Cumulative probability of survival of G86R mice fed a regular diet (solid line) or HFD (dashed line).

Similar articles

Cited by

References

    1. Brooks, B. R., Sanjak, M., Belden, D., Juhasz-Poscine, K. & Waclawik, A. (2000) in Amyotrophic Lateral Sclerosis, eds. Brown, R. H., Jr., Meininger, V. & Swash, M. (Dunitz, London), pp. 31–58.
    1. Rosen, D. R., Siddique, T., Patterson, D., Figlewicz, D. A., Sapp, P., Hentati, A., Donaldson, D., Goto, J., O'Regan, J. P., Deng, H. X., et al. (1993) Nature 362, 59–62. - PubMed
    1. Gurney, M. E., Pu, H., Chiu, A. Y., Dal Canto, M. C., Polchow, C. Y., Alexander, D. D., Caliendo, J., Hentati, A., Kwon, Y. W., Deng, H. X., et al. (1994) Science 264, 1772–1775. - PubMed
    1. Ripps, M. E., Huntley, G. W., Hof, P. R., Morrison, J. H. & Gordon, J. W. (1995) Proc. Natl. Acad. Sci. USA 92, 689–693. - PMC - PubMed
    1. Wong, P. C., Pardo, C. A., Borchelt, D. R., Lee, M. K., Copeland, N. G., Jenkins, N. A., Sisodia, S. S., Cleveland, D. W. & Price, D. L. (1995) Neuron 14, 1105–1116. - PubMed

Publication types

LinkOut - more resources