

Efficient computation of significance levels for multiple associations in large studies of correlated data, including genomewide association studies
- PMID: 15266393
- PMCID: PMC1182021
- DOI: 10.1086/423738
Efficient computation of significance levels for multiple associations in large studies of correlated data, including genomewide association studies
Abstract
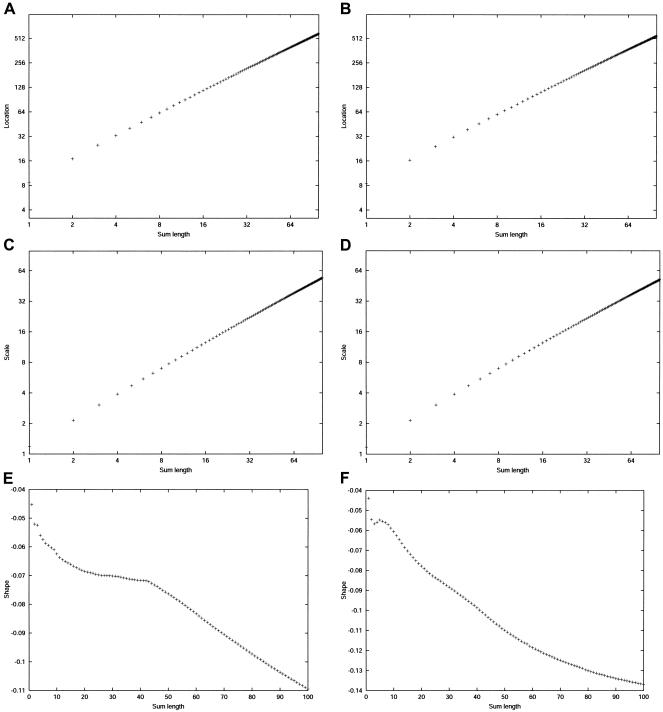
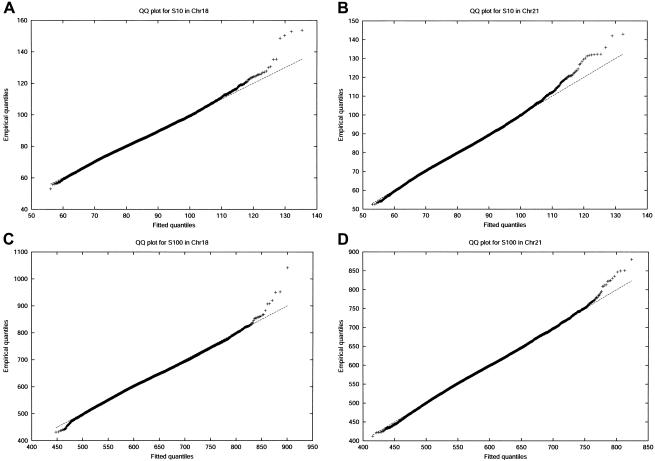
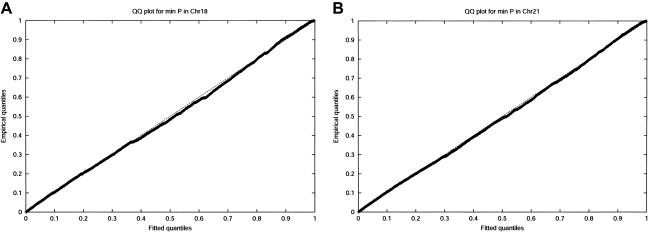
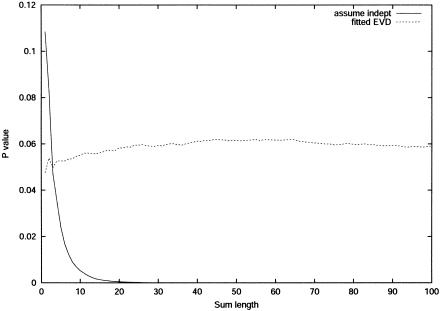
Large exploratory studies, including candidate-gene-association testing, genomewide linkage-disequilibrium scans, and array-expression experiments, are becoming increasingly common. A serious problem for such studies is that statistical power is compromised by the need to control the false-positive rate for a large family of tests. Because multiple true associations are anticipated, methods have been proposed that combine evidence from the most significant tests, as a more powerful alternative to individually adjusted tests. The practical application of these methods is currently limited by a reliance on permutation testing to account for the correlated nature of single-nucleotide polymorphism (SNP)-association data. On a genomewide scale, this is both very time-consuming and impractical for repeated explorations with standard marker panels. Here, we alleviate these problems by fitting analytic distributions to the empirical distribution of combined evidence. We fit extreme-value distributions for fixed lengths of combined evidence and a beta distribution for the most significant length. An initial phase of permutation sampling is required to fit these distributions, but it can be completed more quickly than a simple permutation test and need be done only once for each panel of tests, after which the fitted parameters give a reusable calibration of the panel. Our approach is also a more efficient alternative to a standard permutation test. We demonstrate the accuracy of our approach and compare its efficiency with that of permutation tests on genomewide SNP data released by the International HapMap Consortium. The estimation of analytic distributions for combined evidence will allow these powerful methods to be applied more widely in large exploratory studies.
Figures
References
-
- Bailey TL, Grundy WN (1999) Classifying proteins by family using the product of correlated p-values. Paper presented at the Third International Conference on Computational Molecular Biology, Lyon, France, April 11–14
-
- Benjamini Y, Hochberg Y (1995) Controlling the false discovery rate: a practical and powerful approach to multiple testing. J R Stat Soc B 57:289–300
Publication types
MeSH terms
Substances
LinkOut - more resources
Full Text Sources
