. 2004 Jul 21;24(29):6457-65.
doi: 10.1523/JNEUROSCI.0901-04.2004.

Absence of C1q leads to less neuropathology in transgenic mouse models of Alzheimer's disease

Affiliations

Absence of C1q leads to less neuropathology in transgenic mouse models of Alzheimer's disease

Maria Isabel Fonseca et al. J Neurosci. .

Abstract

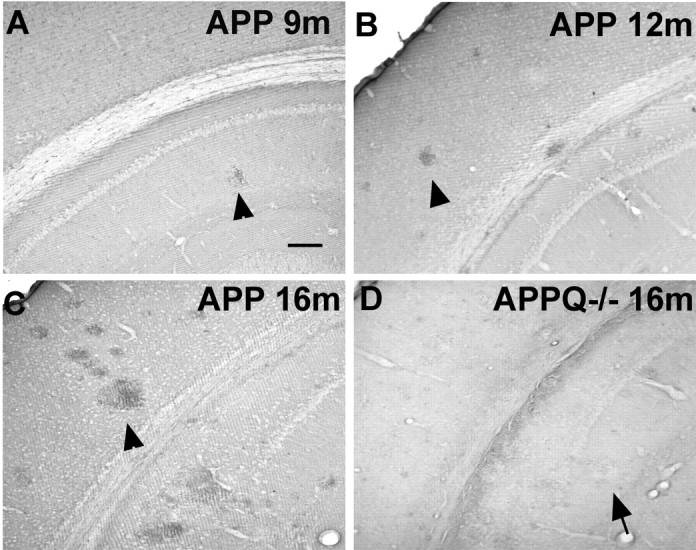
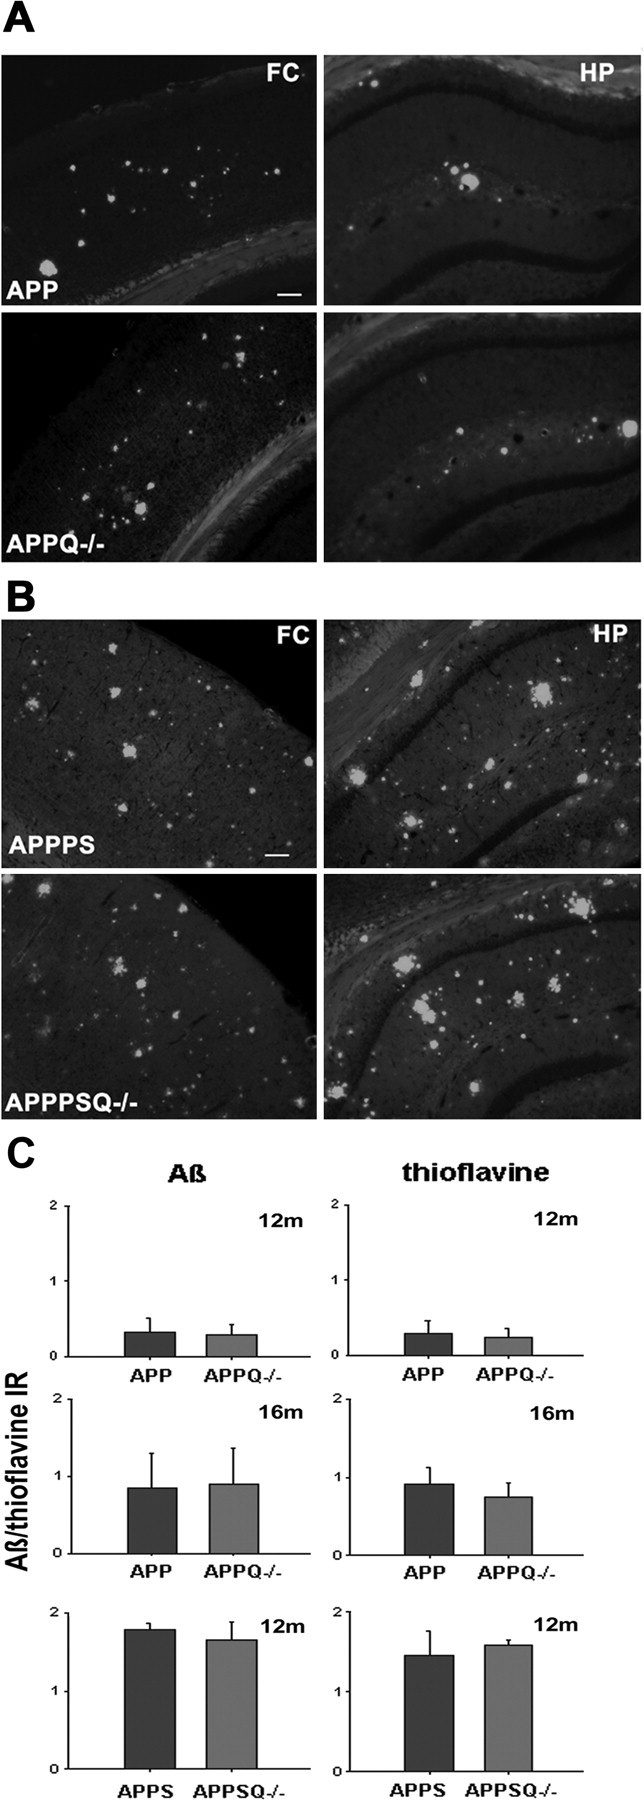
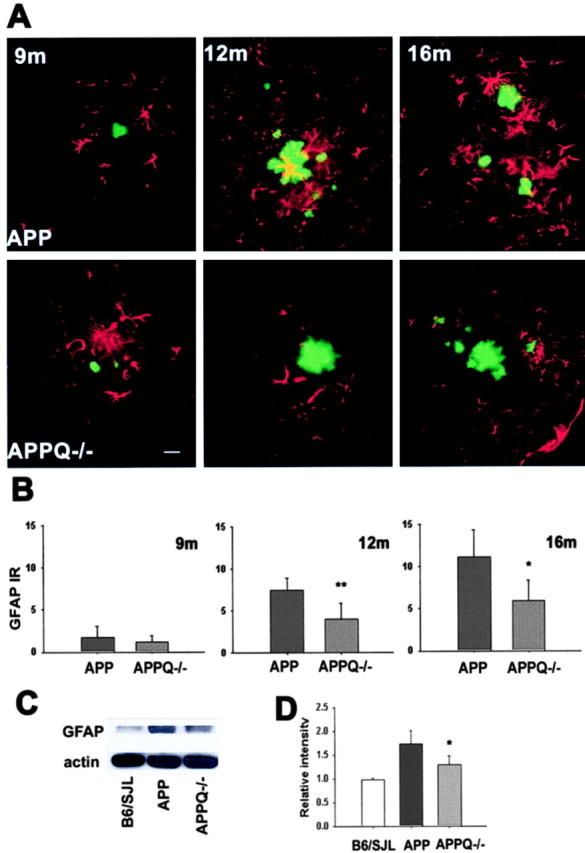
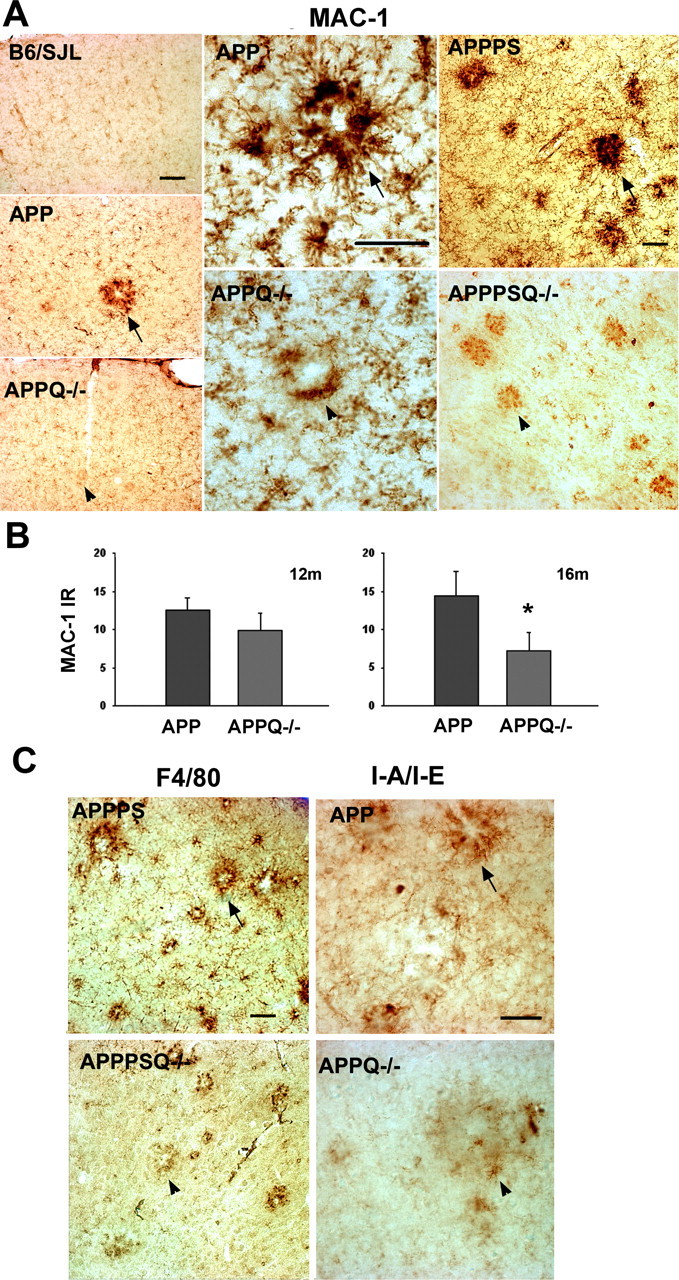
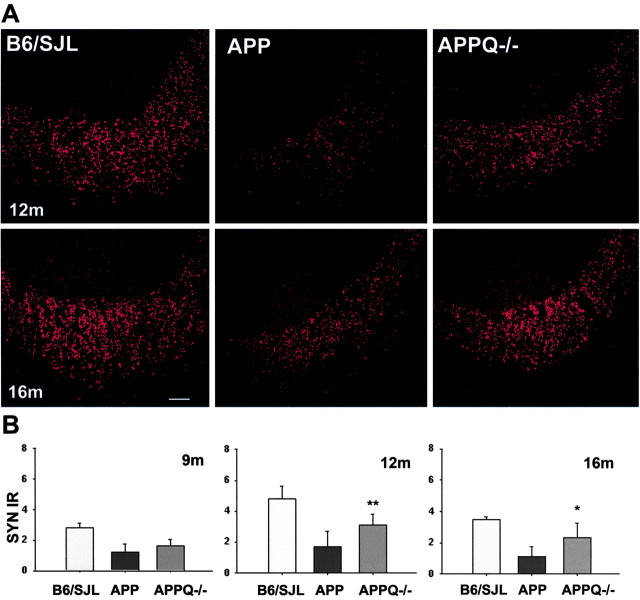
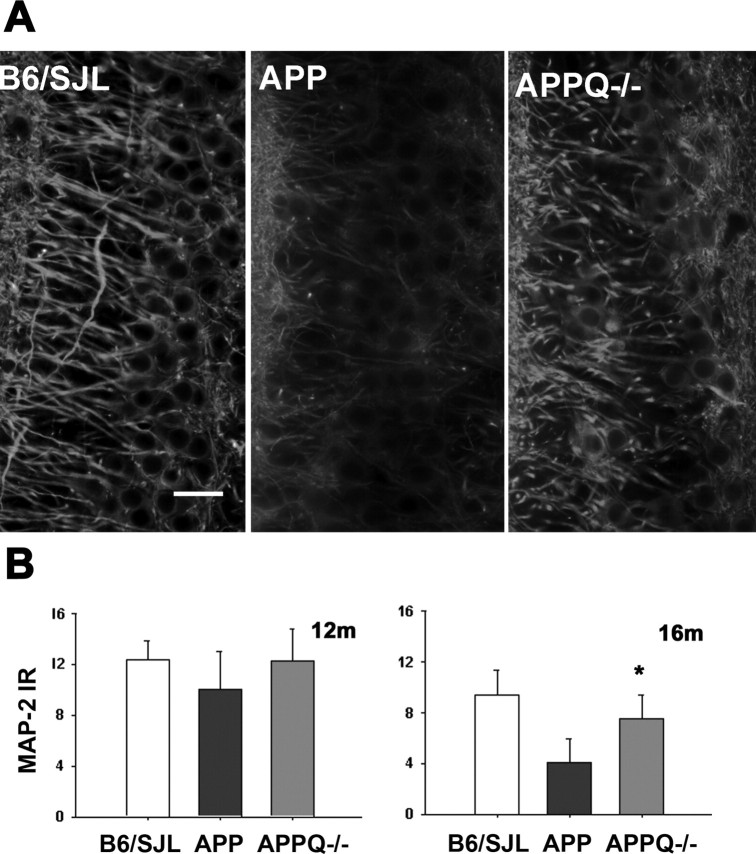
C1q, the recognition component of the classical complement activation pathway, is a multifunctional protein known to be expressed in brain of Alzheimer's disease (AD) patients. To experimentally address the role of C1q in AD, a mouse model lacking C1q (APPQ-/-) was generated by crossing Tg2576 animals (APP) with C1q-deficient mice. The pathology of APPQ-/- was compared with that of APP mice and B6SJL controls at 3-16 months of age by immunohistochemistry and Western blot analysis. At younger ages (3-6 months), when no plaque pathology was present, no significant differences were seen in any of the neuronal or glial markers tested. At older ages (9-16 months), the APP and APPQ-/- mice developed comparable total amyloid and fibrillar beta-amyloid in frontal cortex and hippocampus; however, the level of activated glia surrounding the plaques was significantly lower in the APPQ-/- mice at 12 and 16 months. In addition, although Tg2576 mice showed a progressive decrease in synaptophysin and MAP2 in the CA3 area of hippocampus compared with control B6SJL at 9, 12, and 16 months, the APPQ-/- mice had significantly less of a decrease in these markers at 12 and 16 months. In a second murine model for AD containing transgenes for both APP and mutant presenilin 1 (APP/PS1), a similar reduction of pathology was seen in the APPPS1Q-/- mice. These data suggest that at ages when the fibrillar plaque pathology is present, C1q exerts a detrimental effect on neuronal integrity, most likely through the activation of the classical complement cascade and the enhancement of inflammation.


Figures

Figure 1.
Figure 1.
C1q associates with plaques in APP but not in APPQ-/-. A-D, C1q immunostaining in cortex and hippocampus of APP (A-C) and APPQ-/- (D) at 9 months (A), 12 months (B), and 16 months (C, D). The presence of C1q in plaques (arrowheads) increases in parallel with plaque load and age in the APP mice but is absent in plaques of APPQ-/- (arrow). Scale bar, 100 μm.
Figure 2.
Figure 2.
Comparable levels of Aβ and thioflavine reactivity in APP and APPQ-/- transgenic models. A, B, Representative images of thioflavine staining in frontal cortex (FC) (left) or hippocampus (HP) (right) in APP (top) and APPQ-/- (bottom) at 16 months (A) or APPPS (top) and APPPSQ-/- (bottom) at 12 months (B). Scalebar, 100 μm. C, Image analysis of Aβ (left panels) and thioflavine (right panels) staining in cortex and hippocampus performed as described in Materials and Methods. Values from multiple images of each section that cover most to all the region of study were averaged per animal per experiment. The mean value per animal (average of 2-3 experiments, total of 3-6 sections) was used to obtain the mean of the genotype. Bars represent genotype mean ± SD from n mice per genotype; APP/APPQ-/-: n = 6 at 16 months and n = 3 at 12 months per each genotype; APPPS/APPPSQ-/-: n = 2 at 12 months per genotype.
Figure 3.
Figure 3.
Decrease in astrocytic reactivity around fibrillar Aβ in APPQ-/- at 12 and 16 months of age. A, Fluorescent GFAP (red)/thioflavine (green) colocalization in cortex of APP (top) and APPQ-/- (bottom) mice at 9 months (left), 12 months (middle), and 16 months (right). Note that the APPQ-/- mouse has less GFAP staining around thioflavine positive plaques (of comparable area to the APP). Scale bar, 20 μm. B, Quantification of GFAP immunoreactivity associated with plaques in APP and APPQ-/- at 9, 12, and 16 months by image analysis (see Materials and Methods). Mean value of each animal per genotype is the average of values from two to three experiments (total of 3-6 sections) in which most to all the region of study was analyzed in each section. Bars represent group means ± SD from n mice per genotype; n = 6 at 12 and 16 months and n = 3 at 9 months per each genotype. *p < 0.02, **p < 0.007 by single-factor ANOVA test comparing APP and APPQ-/-. C, Representative Western blot of GFAP and β actin in brain lysates of B6/SJL, APP, and APPQ-/- mice at 16 months. D, Densitometric quantification of GFAP protein levels in immunoblots of B6/SJL (n = 2), APP (n = 4), and APPQ-/- (n = 4). Values were expressed relative to control [wild-type (WT)] levels. Bars represent group means ± SD of n mice per genotype. *p < 0.05 by single-factor ANOVA test comparing APP and APPQ-/-.
Figure 4.
Figure 4.
Lower microglial activation is seen in the proximity of plaques in the APPQ-/- and APPPSQ-/- mice. A, Representative pictures of MAC-1 immunostaining in cortex of 16 months B6/SJL, APP, and APPQ-/- (left panels), in 16 months APP and APPQ-/- plaque area (middle panels), and in cortex of 12 months APPPS and APPPSQ-/- (right panels). Note the decreased MAC-1 immunoreactivity in the area surrounding the plaque of the APPQ-/- or APPPSQ-/- mice (arrowheads) compared with the Q+/+ genotype (arrows). Scale bars: left panels, 100 μm; middle and right panels, 50 μm. B, MAC-1 area percentage associated with plaques in the APP and APPQ-/- mice at 12 and 16 months. Values from multiple images of a section that cover most to all the region of study were averaged per animal per experiment The mean value per animal (average of 2-3 experiments, total of 3-6 sections) was used to obtain the mean of the genotype. Bars represent genotype mean ± SD from n mice per genotype; n = 6 at 16 months and n = 3 at 12 months per each genotype. *p < 0.003 by single-factor ANOVA. C, Representative pictures of other microglial markers F4/80 and I-A/I/E in APPPS, APPSQ-/-, APP, and APPQ-/- animals also showing decreased immunoreactivity in the Q-/- genotypes. Scale bar, 50 μm.
Figure 5.
Figure 5.
Smaller decrease of synaptophysin density in APPQ-/- at 12 and 16 months. A, Representative images of synaptophysin fluorescent immunostaining in the CA3a area of hippocampus of B6/SJL (left), APP (middle), and APPQ-/- (right) mice at 12 months (top) and 16 months (bottom). Increased punctate staining (SYN terminals) is seen in the stratum lucidum of APPQ-/- compared with APP mice. Scale bar, 20 μm. B, Image analysis of SYN immunoreactivity in the CA3a area of hippocampus of the three groups at 9, 12, and 16 months. Mean of each animal is the average of the values from two to three experiments (total of 3-6 sections) in which most to all the region of study was analyzed in each section. Bars represent group means ± SD of n mice per genotype; n = 6 at 12 and 16 months (B6/SJL, n = 4) and n = 3 at 9 months per each genotype. *p < 0.03, **p < 0.009 (by ANOVA).
Figure 6.
Figure 6.
APPQ-/- mice show higher MAP-2 immunoreactivity than APP mice. A, MAP-2 fluorescent immunostaining in the CA3c area of hippocampus (stratum pyramidale) in B6/SJL, APP, and APPQ-/-mice at 16 months. Higher MAP staining is observed in the pyramidal neurons of the APPQ-/- than in the APP mice. Scale bar, 20 μm. B, Quantification by image analysis of MAP-2 immunoreactivity in B6/SJL, APP, and APPQ-/- at 12 and 16 months. Values from multiple images of a section that cover most to all the region of study were averaged per animal per experiment. The mean value per animal (average of 2-3 experiments, total of 3-6 sections) was used to obtain the mean of the genotype. Bars represent genotype mean ± SD from n mice per genotype; n = 6 at 12 and 16 months per each genotype (B6/SJL, n = 4). Bars represent group means ± SD of n mice per genotype. *p < 0.03 by single-factor ANOVA.

References

    1. Afagh A, Cummings BJ, Cribbs DH, Cotman CW, Tenner AJ (1996) Localization and cell association of C1q in Alzheimer's disease brain. Exp Neurol 138: 22-32. - PubMed
    1. Akiyama H, Barger S, Barnum S, Bradt B, Bauer J, Cole GM, Cooper NR, Eikelenboom P, Emmerling M, Fiebich BL, Finch CE, Frautschy S, Griffin WS, Hampel H, Hull M, Landreth G, Lue L, Mrak R, Mackenzie IR, McGeer PL, et al. (2000) Inflammation and Alzheimer's disease. Neurobiol Aging 21: 383-421. - PMC - PubMed
    1. Apelt J, Schliebs R (2001) Beta-amyloid-induced glial expression of both pro- and anti-inflammatory cytokines in cerebral cortex of aged transgenic Tg2576 mice with Alzheimer plaque pathology. Brain Res 894: 21-30. - PubMed
    1. Ashe KH (2001) Learning and memory in transgenic mice modeling Alzheimer's disease. Learn Mem 8: 301-308. - PubMed
    1. Bartoo GT, Nochlin D, Chang D, Kim Y, Sumi SM (1997) The mean A beta load in the hippocampus correlates with duration and severity of dementia in subgroups of Alzheimer disease. J Neuropathol Exp Neurol 56: 531-540. - PubMed

Publication types