. 2004 Jul 21;24(29):6466-75.
doi: 10.1523/JNEUROSCI.4737-03.2004.

Alteration of neuronal firing properties after in vivo experience in a FosGFP transgenic mouse

Affiliations

Alteration of neuronal firing properties after in vivo experience in a FosGFP transgenic mouse

Alison L Barth et al. J Neurosci. .

Abstract

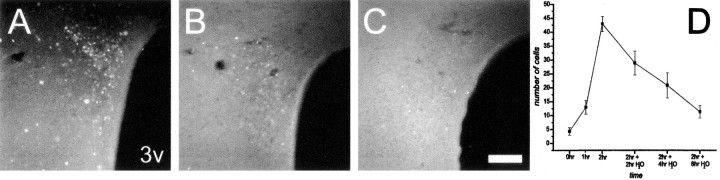
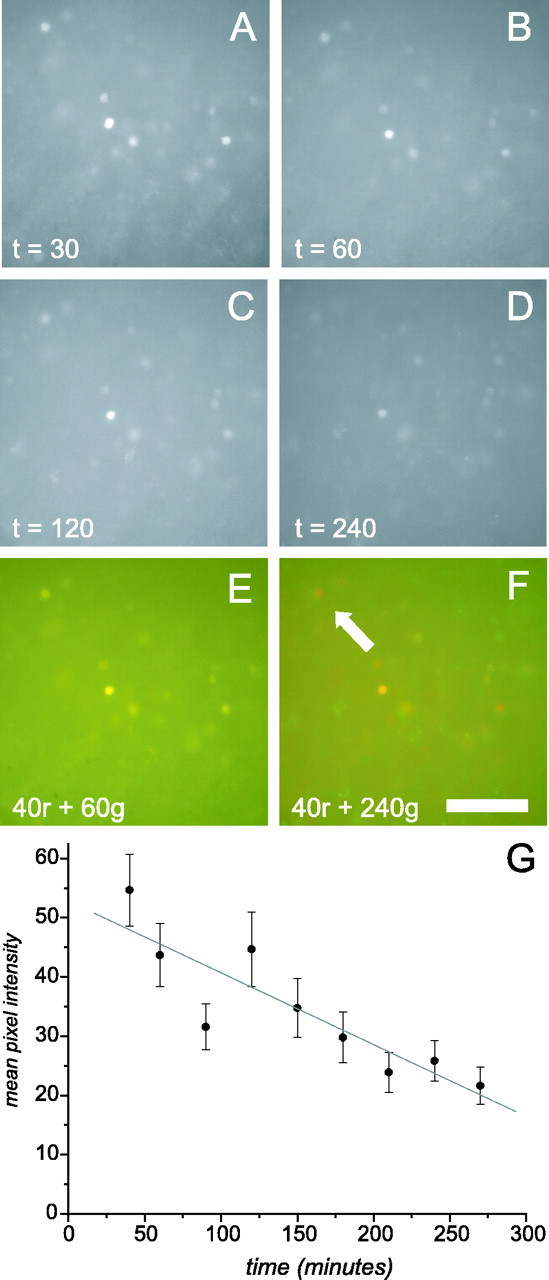
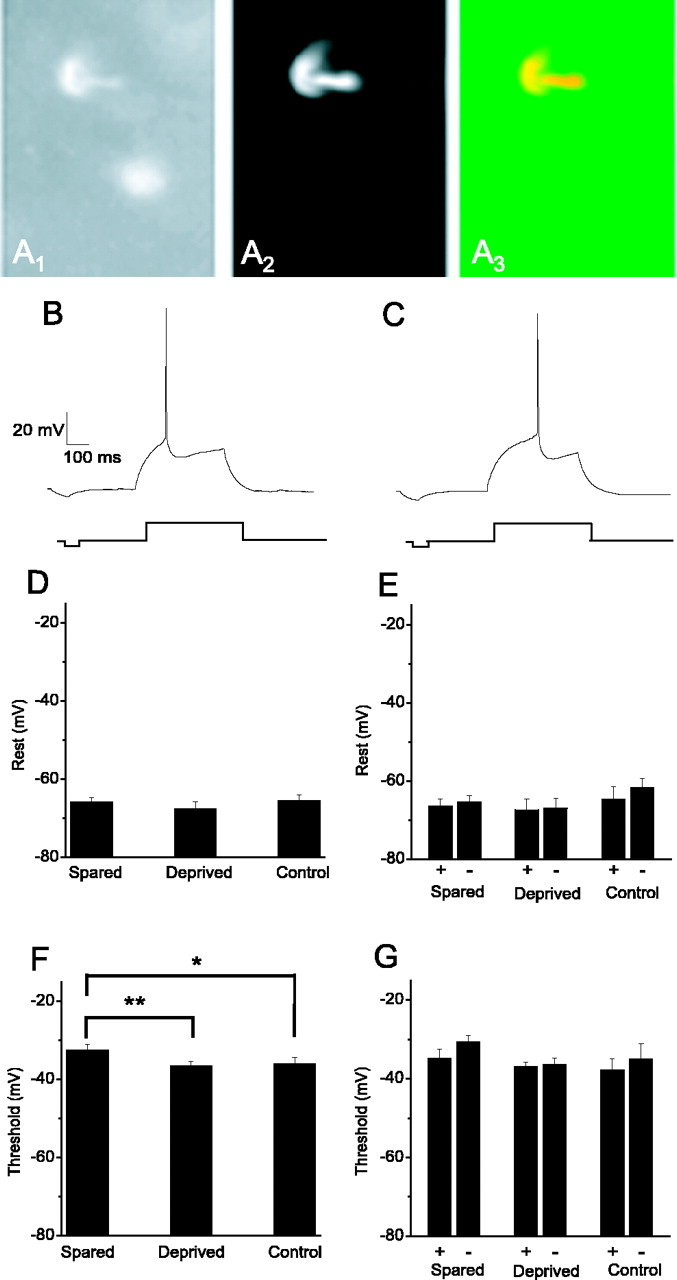
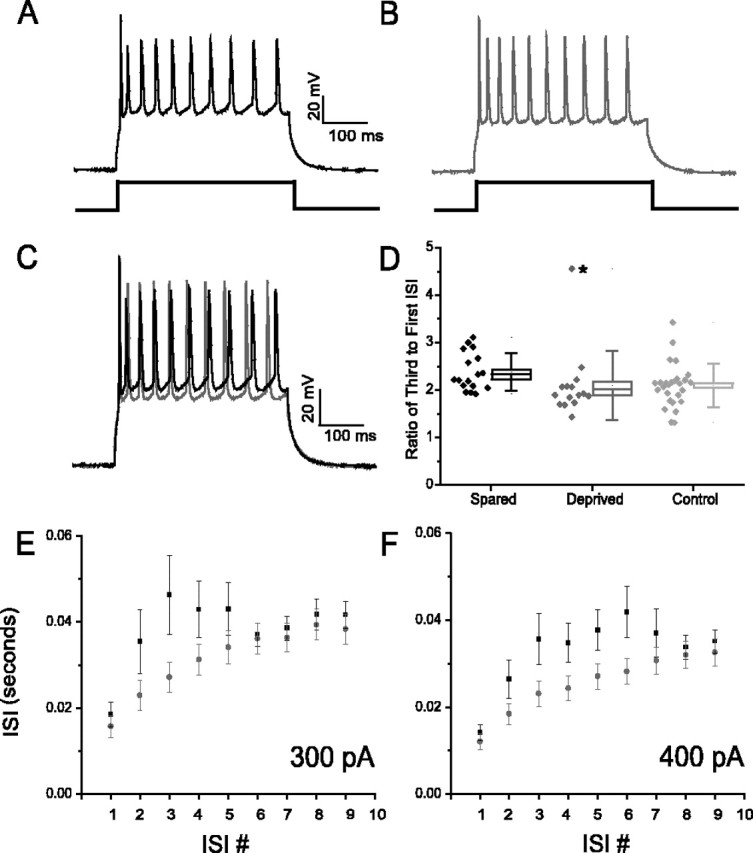
Identifying the cells and circuits that underlie perception, behavior, and learning is a central goal of contemporary neuroscience. Although techniques such as lesion analysis, functional magnetic resonance imaging, 2-deoxyglucose studies, and induction of gene expression have been helpful in determining the brain areas responsible for particular functions, these methods are technically limited. Currently, there is no method that allows for the identification and electrophysiological characterization of individual neurons that are associated with a particular function in living tissue. We developed a strain of transgenic mice in which the expression of the green fluorescent protein (GFP) is controlled by the promoter of the activity-dependent gene c-fos. These mice enable an in vivo or ex vivo characterization of the cells and synapses that are activated by particular pharmacological and behavioral manipulations. Cortical and subcortical fosGFP expression could be induced in a regionally restricted manner after specific activation of neuronal ensembles. Using the fosGFP mice to identify discrete cortical areas, we found that neurons in sensory-spared areas rapidly regulate action potential threshold and spike frequency to decrease excitability. This method will enhance our ability to study the way neuronal networks are activated and changed by both experience and pharmacological manipulations. In addition, because activated neurons can be functionally characterized, this tool may enable the development of better pharmaceuticals that directly affect the neurons involved in disease states.


Figures

Figure 1.
Figure 1.
Structure of the fosGFP fusion transgene. The promoter and coding region from the murine c-fos gene was fused in frame to EGFP to create a C-terminal fosGFP fusion protein.
Figure 2.
Figure 2.
fosGFP induction after physiological and pharmacological stimuli. A, B, fosGFP expression is induced in the PVN after dehydration (A) but not in control, PBS-injected animals (B; line 6-1 shown). 3v, Third ventricle. C, D, Clozapine stimulates increased fosGFP expression in the striatum (C) compared with control, PBS-injected animals (D). cc, Corpus callosum; lv, lateral ventricle. Scale bar, 100 μm.
Figure 3.
Figure 3.
Sensory-induced expression of fosGFP in living brain tissue. All but a single large facial vibrissa, whisker D1, were removed by plucking from a fosGFP transgenic mouse (line 1-3, line 4-1, or line 5-1), aged ∼4 weeks. The animal was returned to its home cage for 24 hr before brain slices were prepared. A, Fixed and flattened section of cortex from the deprived hemisphere, showing fosGFP fluorescence in cells from layer IV of the spared whisker barrel, D1 (indicated by asterisk). B, Fixed and flattened cortex from the contralateral, unplucked hemisphere showing no fosGFP signal in the barrels. Scale bar, 100 μm. C, Low-magnification view of a coronal section of cortex, showing a single medial barrel that corresponds to the D1 whisker showing strong GFP fluorescence in living tissue. Scale bar, 200 μm. D, High-magnification view of C, with layer IV of the spared barrel in focus. Note the sharp edges delineated by fosGFP expression, corresponding to the margins of the spared barrel. E, High-magnification view of C, with layer II-III of the spared barrel in focus. Scale bar: B, C, 100 μm.
Figure 4.
Figure 4.
Sensory stimulation increases both the number and intensity of fosGFP+ cells in barrel cortex. A, Quantitation of the number of fosGFP+ cells in control versus the spared whisker barrel in layer IV and layer II-III. B, Average pixel intensity of labeled cells increases after single-whisker stimulation. Error bars in A and B represent SE. C, Example of labeled nuclei (arrow) and unlabeled cells (chevron) from layer II-III of D1-only cortex. D, The same as C but in contralateral unplucked cortex from the same animal. Scale bar, 20 μm.
Figure 5.
Figure 5.
Duration of fosGFP fluorescence after in vivo stimulation. A-C, fosGFP transgenic animals were injected with hypertonic saline as a dehydration stimulus and simultaneously deprived of water for 2 hr, and fosGFP expression (A) was examined in the PVN at this time. Water was reintroduced ad libitum, and fosGFP signal is shown at 2 (B) and 6 (C) hr after water reintroduction. D, The number of fosGFP+ cells at each time point was calculated to determine the duration of fosGFP+ cells in the PVN after stimulus resolution. Error bars represent SE. 3v, Third ventricle. Scale bar, 100 μm.
Figure 6.
Figure 6.
Preparation of brain slices does not induce fosGFP expression. Brain slices from a control fosGFP transgenic animal were made and examined shortly after tissue preparation. In all panels, t = 0 is time of decapitation, and brains were in ice-cold saline for the first 20-30 min during dissection and slice preparation. A-D, A region of cortex was imaged at multiple time points. E, F, Images from early time points were color-coded red and overlaid on images from later time points that were color-coded green. In this case, cells whose fluorescence disappears would appear red, and cells in which new fosGFP expression was induced would appear green. No new fosGFP-expressing (green) cells arose in the field examined. E, Image from t = 40 min (red) was merged with an image from t = 60 min (green). The snapshot from t = 40 was used for the merged picture because of slight differences in the distance between labeled cells resulting from spreading of the tissue after being positioned in the observation chamber. F, Image from t = 40 min (red) was merged with an image from t = 240 min (green). Note the absence of any (new) green cells in this comparison. Arrow denotes a red cell (i.e., a cell whose GFP fluorescence decreased over this time period). r, Red; g, green. Scale bar, 50 μm. G, fosGFP+ cells show decreased fluorescence over time in perfused brain slices. Average pixel intensity for 10 labeled cells at t = 30 through t = 240 was calculated and plotted versus time. Gray line is a regression for these points (r2 = 0.78) showing a high correlation between incubation time and decrease in fluorescence intensity. Error bars represent SE.
Figure 7.
Figure 7.
Threshold for action potential generation is raised in the spared barrel. A, Example of fosGFP+ cell from layer II-III of barrel cortex that was targeted for whole-cell voltage-clamp recording. A1, fosGFP+ nuclei. A2, Patch solution contained the red fluorescent dye Alexa-568 (10 μm) to fill the targeted cell during recording. A3, Merged picture of A and B shows that the Alexa-filled cell has a fosGFP+ nucleus. Scale bar, 30 μm. B, C, The minimal current to elicit an action potential in fosGFP+ (B) or fosGFP- (C) neurons under control conditions was determined, and the spike threshold was determined by averaging the inflection point from at least two rheobase traces. D, Resting potential from neurons in spared (n = 30), deprived (n = 22), or control (n = 28) tissue was unaltered. E, Data for Vrest of fosGFP+ and fosGFP- neurons for each experimental condition (spared, n = 13+, 17-; deprived, n = 8+, 13-; control, n = 8+, 9-). F, The average threshold for neurons in the spared barrel (n = 28) was altered compared with neurons from whisker-deprived barrels (**p < 0.05; n = 20) or control, unplucked animals (*p < 0.1; n = 15). G, Data for Vthreshold of fosGFP+ and fosGFP- neurons for each experimental condition (spared, n = 12+, 16-; deprived, n = 7+, 13-; control, n = 7+, 8-).
Figure 8.
Figure 8.
More active neurons show increased spike accommodation compared with sensory-deprived or control cells. A, A spike train (10 spikes) elicited by delivering a 400 msec current pulse from a sensory-spared barrel (fosGFP+). B, The same as A but from a neuron (fosGFP+) in an adjacent deprived cortical area. C, Overlay of traces from A and B show that spared barrel neurons show a shorter ISI between the first and second spike and a longer ISI for later spikes in the train. D, Calculation of the ratio of third ISI to first ISI for cells in each condition. Box edges represent SE, and error bars are SD (spared, n = 17; deprived, n = 15; control, n = 27). For spared versus control neurons, p < 0.17; without the outlier point for deprived neurons (asterisk), p < 0.00078. E, ISI for spared (black squares) or deprived (red circles) barrel neurons at a single current pulse amplitude. Increased accommodation is seen for the first few spikes in the train in spared versus deprived barrel neurons. Increased accommodation is seen for the first few spikes in the train in spared versus deprived barrel neurons. F, The same as in E but for a larger current pulse amplitude. With larger current pulse amplitudes, note that the difference in ISI is greater at each specific ISI. p values for spared and deprived ≥0.1 at ISIs 3, 4, and 5 for 300 pA and ISIs 3, 4, 5, and 6 for 400 pA graph.

References

    1. Barth AL (2002) Differential plasticity in neocortical networks. Physiol Behav 77: 545-550. - PubMed
    1. Barth AL, McKenna M, Glazewski S, Hill P, Impey S, Storm D, Fox K (2000) Upregulation of cAMP response element-mediated gene expression during experience-dependent plasticity in adult neocortex. J Neurosci 20: 4206-4216. - PMC - PubMed
    1. Bernstein LR, Ferris DK, Colburn NH, Sobel ME (1994) A family of mitogen-activated protein kinase-related proteins interacts in vivo with activator protein-1 transcription factor. J Biol Chem 269: 9401-9404. - PubMed
    1. Cole AJ, Saffen DW, Baraban JM, Worley PF (1989) Rapid increase of an immediate early gene messenger RNA in hippocampal neurons by synaptic NMDA receptor activation. Nature 340: 474-476. - PubMed
    1. Curran T (1988) The fos oncogene. In: The oncogene handbook (Reddy EP, Skalka AM, Curran T, eds), pp 307-325. Amsterdam: Elsevier Science.

Publication types

MeSH terms

LinkOut - more resources