. 2004 Aug;16(8):2151-63.
doi: 10.1105/tpc.104.021972. Epub 2004 Jul 21.

Hydrogen photoproduction is attenuated by disruption of an isoamylase gene in Chlamydomonas reinhardtii

Affiliations

Hydrogen photoproduction is attenuated by disruption of an isoamylase gene in Chlamydomonas reinhardtii

Matthew C Posewitz et al. Plant Cell. 2004 Aug.

Abstract

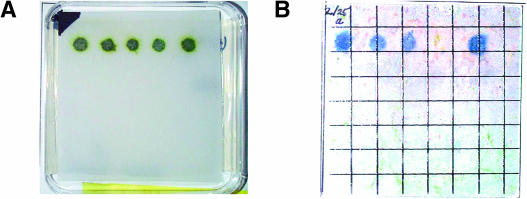
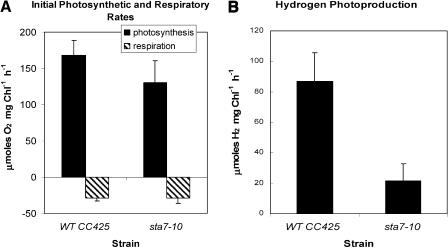
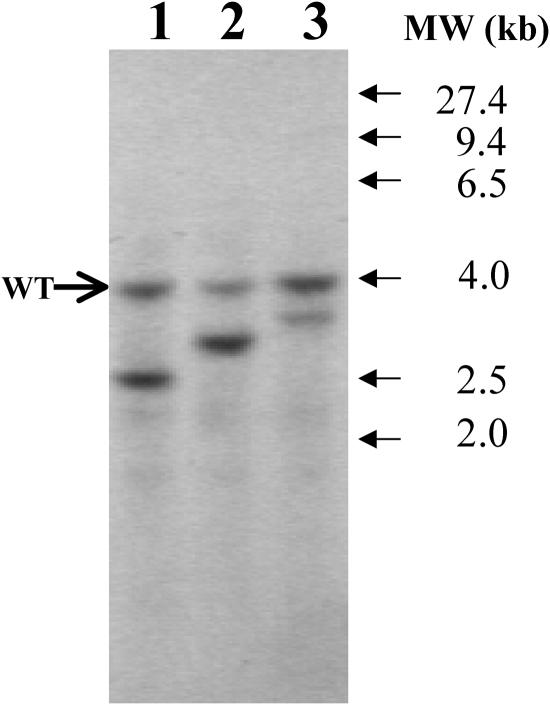
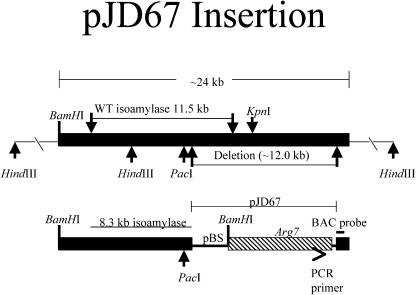
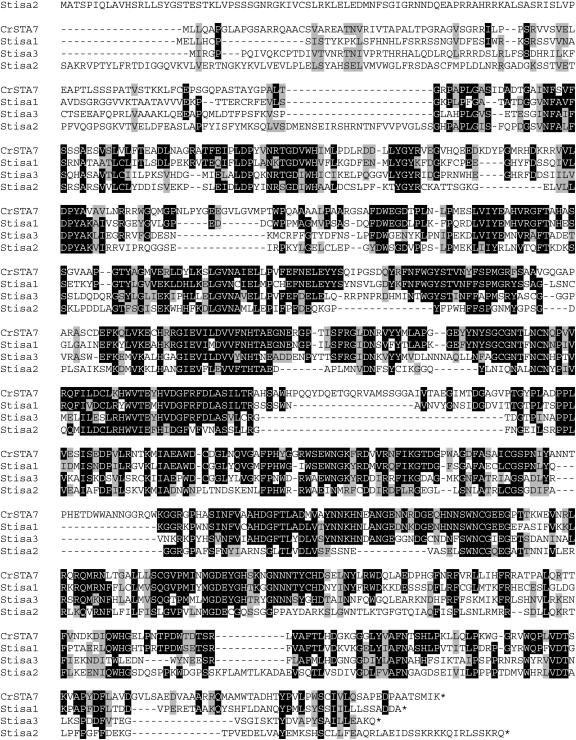
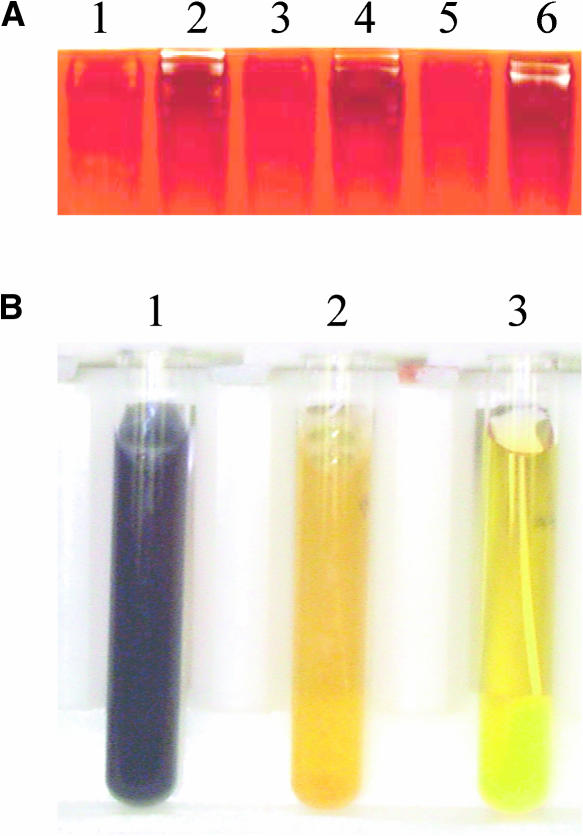
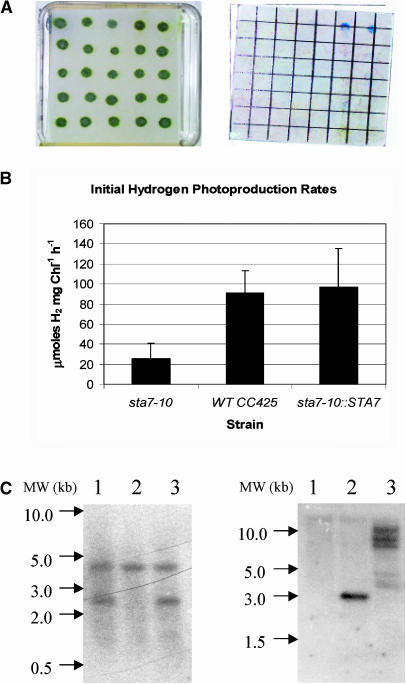
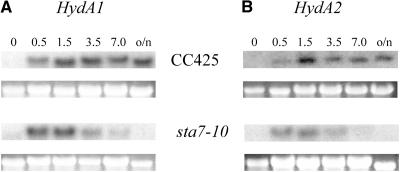
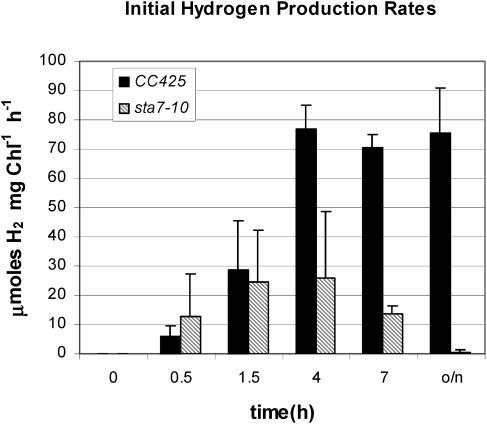
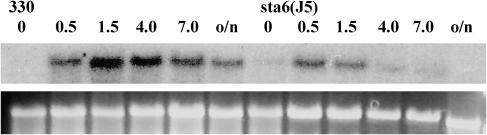
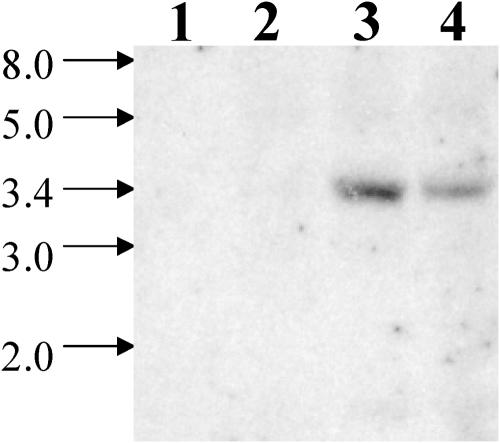
DNA insertional transformants of Chlamydomonas reinhardtii were screened chemochromically for attenuated H(2) production. One mutant, displaying low H(2) gas photoproduction, has a nonfunctional copy of a gene that shows high homology to the family of isoamylase genes found in several photosynthetic organisms. DNA gel blotting and gene complementation were used to link this isoamylase gene to previously characterized nontagged sta7 mutants. This mutant is therefore denoted sta7-10. In C. reinhardtii, the STA7 isoamylase gene is important for the accumulation of crystalline starch, and the sta7-10 mutant reported here contains <3% of the glucose found in insoluble starch when compared with wild-type control cells. Hydrogen photoproduction rates, induced after several hours of dark, anaerobic treatment, are attenuated in sta7 mutants. RNA gel blot analysis indicates that the mRNA transcripts for both the HydA1 and HydA2 [Fe]-hydrogenase genes are expressed in the sta7-10 mutant at greater than wild-type levels 0.5 h after anaerobic induction. However, after 1.5 h, transcript levels of both HydA1 and HydA2 begin to decline rapidly and reach nearly undetectable levels after 7 h. In wild-type cells, the hydrogenase transcripts accumulate more slowly, reach a plateau after 4 h of anaerobic treatment, and maintain the same level of expression for >7 h under anaerobic incubation. Complementation of mutant cells with genomic DNA corresponding to the STA7 gene restores both the starch accumulation and H(2) production phenotypes. The results indicate that STA7 and starch metabolism play an important role in C. reinhardtii H(2) photoproduction. Moreover, the results indicate that mere anaerobiosis is not sufficient to maintain hydrogenase gene expression without the underlying physiology, an important aspect of which is starch metabolism.


Figures

Figure 1.
Figure 1.
Chemochromic Detection of C. reinhardtii Colonies Deficient in the Photoproduction of H2. (A) Colonies grown on a TAP agar plate. (B) Chemochromic sensor after illumination of candidate colonies on the TAP agar plate. Hydrogenase activity was induced by placing the plates in the dark under a N2 atmosphere overnight. Subsequent actinic illumination resulted in the photoproduction of H2, which is visually detected on the sensor as a dark blue spot. The fourth colony from the left failed to produce H2 and thus was the subject of further investigation.
Figure 2.
Figure 2.
Initial Rates of Photosynthesis (O2 Evolution), Respiration (O2 Uptake), and H2 Photoproduction. (A) Measured rates of photosynthesis and respiration. (B) Measured rates of H2 production. Initial rates were measured using a Clark electrode apparatus. Results are shown for both the background strain CC425 and the sta7-10 mutant. The rates of respiration of the two strains are similar, whereas the rate of O2 evolution is slightly lower in the sta7-10 mutant. Hydrogen photoproduction rates are substantially attenuated in the sta7-10 mutant. All samples were induced as described in Methods.
Figure 3.
Figure 3.
Genomic DNA Gel Blot for Arg7 Insertion. Genomic DNA isolated from mutants attenuated in H2 photoproduction was digested with the restriction enzyme PstI. Lane 1 corresponds to DNA isolated from the sta7-10 mutant. The blot was probed using the 130-bp StuI-SphI fragment of the Arg7 gene. The band at 4.0 kb corresponds to the nonfunctional wild-type copy of the arg7 gene, and the band at 2.5 kb corresponds to a single copy of the Arg7 plasmid insert that caused the mutation. Lanes 2 and 3 correspond to other mutants of interest from the same library and demonstrate that, in addition to the wild-type band, one additional site of insertion is observed in these mutants as well.
Figure 4.
Figure 4.
Insertion Map of pJD67 into the C. reinhardtii Genomic DNA of the sta7-10 Mutant. The plasmid pJD67 was linearized by digestion with the restriction enzyme HindIII and transformed into C. reinhardtii strain CC425 using the glass bead method. Integration of pJD67 resulted in the deletion of ∼12 kb of genomic DNA, of which 3.2 kb was located at the 3′ end of the wild-type STA7 gene. This resulted in a 3′ end-truncated and, therefore, nonfunctional copy of the isoamylase gene. Locations of select restriction enzyme sites, the PCR primer used in genome walking, and the probe used to assay the BAC library are also shown.
Figure 5.
Figure 5.
Alignment of the C. reinhardtii Isoamylase Amino Acid Sequence with Three Isoamylase Isoforms from S. tuberosum. Regions of identical amino acids are shown in black and homology regions are shaded in gray. Included in this figure are the C. reinhardtii STA7 protein (STA7) and three separate isoamylase isoforms from S. tuberosum (Stisa1, Stisa2, and Stisa3). The S. tuberosum isoamylase isoforms are ordered according to homology with the C. reinhardtii STA7 protein. The STA7 protein is 54% identical and 65% similar to Stisa1, 42% identical and 56% similar to Stisa3, and 34% identical and 48% similar to Stisa2.
Figure 6.
Figure 6.
Differential Starch Metabolism between the sta7-10 Mutant and the CC425 Background Strain. (A) Zymogram illustrating isoamylase activity. (B) Color-based assay of the starch levels. The zymogram in (A) illustrates the activity of heteromeric complexes containing isoamylase that are capable of breaking down glycogen. Crude cellular extracts were centrifuged, and the supernatant was loaded onto a 7.5% acrylamide native gel containing glycogen. An iodine solution was used to stain areas still containing glycogen after incubation. Lane 1 illustrates the breakdown of starch by the sta7-10 mutant and lane 2, the control CC425. The remaining lanes demonstrate identical alternate samples of the sta7-10 mutant (lanes 3 and 5) and CC425 (lanes 4 and 6). Areas of glycogen breakdown are shown as white bands on a dark background. Assay of starch levels contained in cell extracts stained with iodine solution is shown in (B). The CC425 (tube 1) extract stains a dark purple indicative of high starch levels. By contrast, the sta7-10 mutant (tube 2) remains a light yellow similar to the negative control with no cells (tube 3), indicating a substantially attenuated starch concentration.
Figure 7.
Figure 7.
Complementation of the sta7-10 Background with STA7 Genomic DNA. (A) Algal colonies on TAP plates after complementation with the STA7 gene (left) and chemochromic sensors after illumination (right). (B) Hydrogen production rates. (C) DNA gel blot analysis. The chemochromic sensor (A) indicates that only two colonies at the far right of the first row are able to produce sufficient quantities of H2 for detection. These two clones were also the only colonies with wild-type levels of starch. Hydrogen-production rates (B) in solution measured using a Clark electrode apparatus. The mutant sta7-10 strain shows rates that are 20% to 40% those of the wild-type CC425. Mutant background complemented with STA7 (sta7-10::STA7) shows H2-production rates similar to CC425. DNA gel blot analysis of PstI-digested genomic DNA probed using the 130-bp /StuI-SphI fragment from the Arg7 gene ([C], left). DNA extracted from sta7-10, CC425, and sta7-10::STA7 cultures are shown in lanes 1, 2, and 3, respectively. DNA gel blot analysis of NotI-digested genomic DNA probed with the 114-bp KpnI-SacI fragment from the 3′ end of the genomic STA7 gene ([C], right). DNA samples are as described for the Arg7 blot.
Figure 8.
Figure 8.
RNA Gel Blot Analysis of the Hydrogenase Transcripts. (A) HydA1 in CC425 and sta7-10. (B) HydA2 in CC425 and sta7-10. Samples were grown in TAP media until late log phase, and RNA was isolated as described in Methods at the indicated times (hours) of anaerobic induction. RNA transcripts for both HydA1 and HydA2 were undetected from samples isolated from the oxygenated growth flasks. CC425 and sta7-10 RNA were run on the same blot and probed together for either HydA1 or HydA2 transcripts. Both hydrogenase transcripts from the sta7-10 mutant are detected shortly after the beginning of anaerobic induction, and their levels peak at ∼0.5 h. Thereafter, a steady decline to undetectable levels is observed. Background CC425 cells showed slower induction of hydrogenase transcript, which peaked at ∼1.5 h and remained at essentially steady state levels for the duration of the experiment. The ribosomal 23S RNA band is shown as a loading control below each RNA gel blot. o/n, overnight.
Figure 9.
Figure 9.
Hydrogen Evolution Rates as a Function of Anaerobic Induction Time. Rates of hydrogen evolution measured using a Clark electrode apparatus. Results are shown for the sta7-10 mutant (shaded bars) and the background strain CC425 (closed bars). Hydrogenase activity was induced as described in the Methods section. Samples were withdrawn from anaerobic cultures and assayed at the indicated times.
Figure 10.
Figure 10.
Initial H2 Photoproduction Rates from Starch Mutants. Initial H2 photoproduction rates were measured from previously isolated starch mutants using a Clark-type electrode apparatus. Results are shown, respectively, for the parental background strain (330), a sta6 mutant (BAFJ5), two sta7 mutants (BAFJ4 and S), which were combined into a single data set, and a sta7 mutant (BAFJ4) that was complemented with DNA corresponding to the isoamylase gene. Hydrogen photoproduction rates are attenuated in the sta6 and sta7 mutants. Complementation of the sta7 (BAFJ4) mutant with the isoamylase gene restores wild-type H2 photoproduction rates. All samples were induced as described in Methods. The starch mutants were previously isolated in Steven Ball's laboratory.
Figure 11.
Figure 11.
RNA Gel Blot Analysis of the Hydrogenase Transcripts in Parental Wild-Type Strains 330 and sta6 (BAFJ5). Samples were grown in TAP media until late log phase, and RNA was isolated as described in Methods at the indicated times (hours) of anaerobic induction. RNA transcripts for HydA1 were undetected from samples isolated from the aerobic growth flasks. Wild-type (330) and sta6 (BAFJ5) RNA were run on the same blot and probed together for HydA1 transcripts. HydA1 transcripts from the 330 and sta6 (BAFJ5) strains were detected shortly after the beginning of anaerobic induction (0.5 h). In the sta6 (BAFJ5) mutant, HydA1 transcript levels peak at 0.5 h. Immediately thereafter, a steady decline to nearly undetectable levels is observed by 4.0 h. In the background 330 cells, HydA1 transcript levels peak at 1.5 h. A slow decline in HydA1 transcript levels is then observed during the remainder of the experiment. The ribosomal 23S RNA band is shown as a loading control below each RNA gel blot.
Figure 12.
Figure 12.
Genomic DNA Gel Blot Using Previously Identified Starch Mutants. Genomic DNA isolated from previously identified starch mutants was digested with the restriction enzyme NcoI. Lanes 1 to 4 correspond, respectively, to DNA isolated from two sta7 mutants (BAFJ4 and S), a sta6 mutant (BAFJ5), and a sta8 strain (BAFV13). The blot was probed using the 690-bp NcoI-SphI DNA fragment from the isoamylase gene. The band at 3.4 kb corresponds to the isoamylase gene. The isoamylase band is absent in DNA isolated from both of the sta7 mutants.

Similar articles

Cited by

References

    1. Adam, M., and Loppes, R. (1998). Use of the ARG7 gene as an insertional mutagen to clone PHON24, a gene required for derepressible neutral phosphatase activity in Chlamydomonas reinhardtii. Mol. Gen. Genet. 258, 123–132. - PubMed
    1. Adams, M.W.W. (1990). The structure and mechanism of iron-hydrogenases. Biochim. Biophys. Acta 1020, 115–145. - PubMed
    1. Asada, Y., and Miyake, J. (1999). Photobiological hydrogen production. J. Biosci. Bioeng. 88, 1–6. - PubMed
    1. Ball, S. (1998). Regulation of starch biosynthesis. In The Molecular Biology of Chloroplasts and Mitochondria in Chlamydomonas, Vol. 7, J.D. Rochaix, M. Goldschmiidt-Clermont, and S. Merchant, eds (Dordrecht, The Netherlands: Kluwer Academic Publishers), pp. 549–567.
    1. Ball, S., Guan, H.P., James, M., Myers, A., Keeling, P., Mouille, G., Buleon, A., Colonna, P., and Preiss, J. (1996). From glycogen to amylopectin: A model for the biogenesis of the plant starch granule. Cell 86, 349–352. - PubMed

Publication types

MeSH terms

Associated data

LinkOut - more resources