Comparative Study
. 2004 Sep 15;559(Pt 3):883-98.
doi: 10.1113/jphysiol.2004.068619. Epub 2004 Jul 22.

Regulation of tissue oxygen levels in the mammalian lens

Affiliations
Comparative Study

Regulation of tissue oxygen levels in the mammalian lens

Richard McNulty et al. J Physiol. .

Abstract

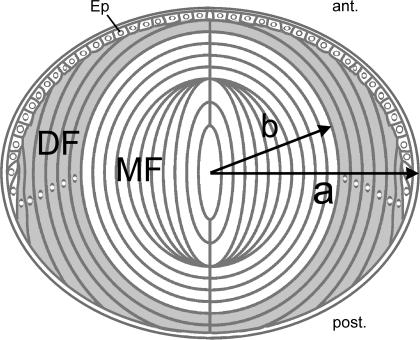
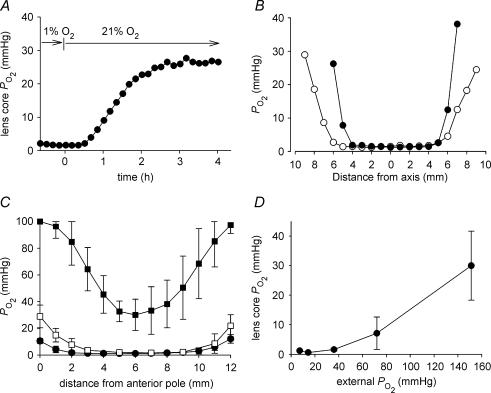
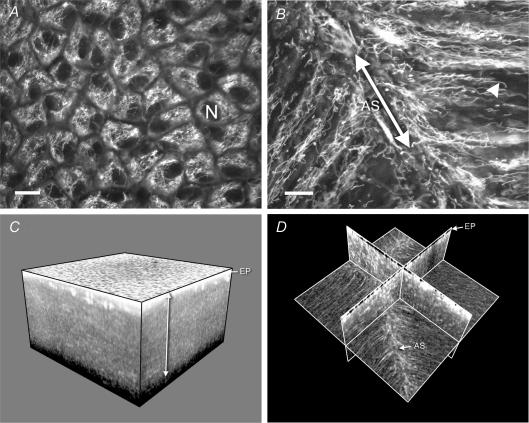
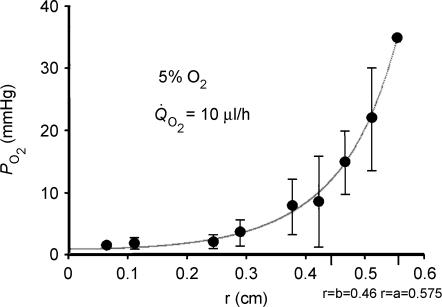
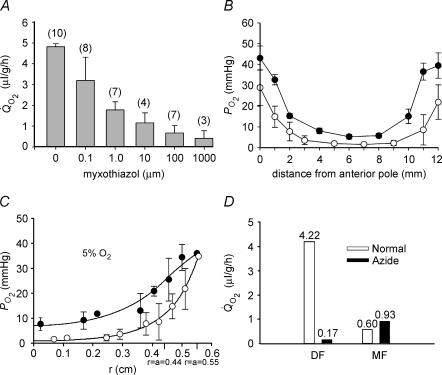
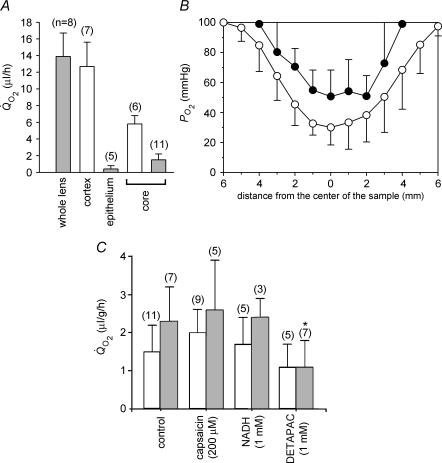
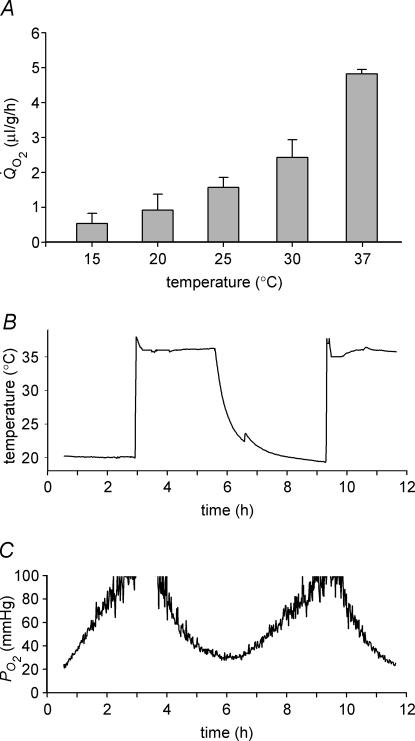
Opacification of the lens nucleus is a major cause of blindness and is thought to result from oxidation of key cellular components. Thus, long-term preservation of lens clarity may depend on the maintenance of hypoxia in the lens nucleus. We mapped the distribution of dissolved oxygen within isolated bovine lenses and also measured the rate of oxygen consumption (QO2) by lenses, or parts thereof. To assess the contribution of mitochondrial metabolism to the lens oxygen budget, we tested the effect of mitochondrial inhibitors on (QO2) and partial pressure of oxygen (PO2). The distribution of mitochondria was mapped in living lenses by 2-photon microscopy. We found that a steep gradient of PO2 was maintained within the tissue, leading to PO2 < 2 mmHg in the core. Mitochondrial respiration accounted for approximately 90% of the oxygen consumed by the lens; however, PO2 gradients extended beyond the boundaries of the mitochondria-containing cell layer, indicating the presence of non-mitochondrial oxygen consumers. Time constants for oxygen consumption in various regions of the lens and an effective oxygen diffusion coefficient were calculated from a diffusion-consumption model. Typical values were 3 x 10(-5) cm(2) s(-1) for the effective diffusion coefficient and a 5 min time constant for oxygen consumption. Surprisingly, the calculated time constants did not differ between differentiating fibres (DF) that contained mitochondria and mature fibres (MF) that did not. Based on these parameters, DF cells were responsible for approximately 88% of lens oxygen consumption. A modest reduction in tissue temperature resulted in a marked decrease in (QO2) and the subsequent flooding of the lens core with oxygen. This phenomenon may be of clinical relevance because cold, oxygen-rich solutions are often infused into the eye during intraocular surgery. Such procedures are associated with a strikingly high incidence of postsurgical nuclear cataract.


Figures

Figure 7
Figure 7. Diagrammatic cross-section of the lens
At the anterior (ant.), the lens is bounded by an epithelium (Ep). The bulk of the tissue is composed of concentric layers of fibre cells. Differentiating fibres (DF, shaded region) near the surface contain a normal complement of organelles. Mature fibres (MF) located in the central region of the tissue do not contain organelles. The model calculations assume a spherical lens of radius a (cm) in which the border between DF and MF is located at a distance b (cm) from the centre.
Figure 1
Figure 1. The relationship between internal and external PO2 in the isolated bovine lens
A, the optode tip was inserted into the lens core and the response of core PO2 to a change in the oxygen concentration of the bathing medium (from 1 to 21%) was monitored. Note that a new steady-state value was established within 4 h. B, intralenticular PO2 profiles were recorded from a single lens along the polar (•) or equatorial axis (○). Measurements were made in tissue equilibrated with 5% external oxygen. The profiles are symmetric and exhibit steep cortical PO2 gradients and a central region of low (1–2 mmHg) PO2. C, internal PO2 profiles were measured in bovine lenses equilibrated with 1% (•), 5% (□), or 21% oxygen (▪). In each case, data represent the mean ±s.d. of at least six independent measurements. Note that the upper measurement limit for the optode system is 100 mmHg. This value is exceeded in the peripheral cell layers of lenses incubated in 21% oxygen. The slope of the PO2 profile in the outer 2–3 mm of tissue is artificially reduced as a consequence. D, the relationship between internal PO2(measured in the centre of the lens) and external PO2 was determined in isolated bovine lenses. Note that the PO2 in the centre of the lens does not increase until external PO2 is raised to supraphysiological values (≥ 70 mmHg). Data represent at least six independent measurements at each oxygen concentration.
Figure 2
Figure 2. The distribution of mitochondria in the living bovine lens
A, a confocal image of the lens epithelium viewed en face. Bundles of mitochondria surround the dark, unstained epithelial cell nuclei (N). B, a confocal image of mitochondria located in fibre cells immediately beneath the anterior epithelium. Mitochondria were aligned with the long axis of the fibres and were particularly abundant in the region where the fibre tips converged at the anterior suture (AS). Note the elongated morphology of the mitochondria (an example of which is indicated by the arrowhead). Scale bars in A and B = 10 μm. C, a three-dimensional reconstruction of a region (845 × 845 × 476 μm) of the anterior lens cortex imaged with a 2-photon microscope. The highly fluorescent epithelium (EP) overlies a region of less intense fluorescence emanating from mitochondria located in a superficial layer of cortical fibre cells (arrowed). D, the same data set as C but viewed as a set of orthogonal planes. In this view the distribution of mitochondria within the fibres is apparent. Note the increased fluorescence adjacent to the anterior suture.
Figure 3
Figure 3. The best fit of the consumption–diffusion model (see) to PO2 profiles measured in 5% external oxygen
The data were well fitted by the two-compartment model using Sigma Plot 2000 (SPSS Inc., Chicago, IL, USA). At 5% external oxygen, derived values for the length constants for oxygen consumption in the outer (mitochondria-rich) and central (mitochondria-free) regions of the lens were about 1 mm, which implies that the rates of oxygen consumption in these two domains are nearly the same. Based on measurements of total lens oxygen consumption (O2) in 5% external oxygen and the best fit values of length constants, we estimate that the effective diffusion coefficient for oxygen in the lens is 3 × 10⁻⁵ cm2 s−1 and the time constant for oxygen consumption within any lens cell is about 5 min. Note that 5% oxygen in the bath corresponds to a partial pressure of 36 mmHg.
Figure 4
Figure 4. The effect of mitochondrial inhibitors on lens O2, PO2 profiles, and calculated oxygen consumption time constants
A, lenses were pre-equilibrated in 5% oxygen for 4 h at 37°C. Lens O2 was inhibited by myxothiazol in a dose-dependent fashion. B, effect of myxothiazol on bovine lens PO2 profiles in vitro. Lenses were equilibrated in 5% O2 for 4 h at 37°C in the presence of 10 μm myxothiazol (•, n = 4). Compared to control lenses (○), myxothiazol treated lenses have a higher PO2 throughout the tissue. The PO2 gradient in the outer 2 mm of tissue is less steep in myxothiazol-treated lenses than controls. Note that, in each case, all data points are contained within the lens (the extreme data points nominally at 0 and 12 mm are in fact about 100 μm into the lens, explaining why the PO2 values are less than the values in the superfusion solution). C, incubation of lenses in 5 mm azide (•) also produces a generalized increase in PO2 and a shallower gradient in the superficial cell layers compared to untreated samples (○). The best fit of the diffusion–consumption model indicates that azide treatment causes a significant decrease in the rate of oxygen consumption in the outer shell of mitochondria-rich DF. D, the amount of oxygen consumed by the DF and MF cell layers in the presence or absence of azide was calculated using eqn (10) (Appendix). Note that, in addition to the time constants for oxygen consumption in DF and MF cells, the computed values also reflect the oxygen concentration in each region and the relative volumes of the two zones (see text for details). In the presence of azide, oxygen consumption by DF cells is dramatically reduced. In contrast, azide has little effect on oxygen consumption by the MF cells.
Figure 5
Figure 5. Measurement of and PO2 profiles in regionally dissected bovine lenses
A, Q̇O2 was measured immediately after dissection (open bars) or after a 4 h equilibration period (grey bars). Measurements were made at 37°C in solutions containing 21% oxygen. Cortical samples deteriorated over the 4 h equilibration period. Consequently, only an initial cortical measurement was possible. The relatively high O2 value of the isolated cortex suggests that much of the oxygen consumption of the intact tissue can be attributed to the outer fibre cell layers, though some of the initial consumption represents the redistribution of oxygen from the medium into the relatively hypoxic tissue. In contrast, epithelial oxygen consumption appears to represent only a minor component (approximately 3%) of the total oxygen consumption. The O2 values of equilibrated core samples are significantly lower than those measured immediately after dissection, again probably due to the initial redistribution of oxygen. B, bovine lenses were dissected to remove the DF cell layer. Isolated cores (•) were equilibrated with 21% oxygen. Data from intact lenses (taken from Fig. 1) are shown for comparison (○). Following the removal of the DF cell layer, PO2 is elevated throughout the remaining core sample. However, a steep gradient persists within the core, and even after prolonged incubation, the PO2 within the sample does not equal that in the bathing medium. Data represent mean ±s.d. for 5 independent measurements in each case. C, Q̇O2 was measured in intact (open bars) or homogenized (grey bars) lens cores in the presence or absence of various inhibitors. The O2 values were consistently higher in homogenized samples. Compared to control values, treatment with the PMOR inhibitors capsaicin and NADH had no significant effect on O2 in either intact or homogenized samples. However, treatment of homogenized lens cores with the metal chelator DETAPAC resulted in a significant inhibition of O2. Values that differ significantly (P < 0.05) from controls are indicated by an asterisk.
Figure 6
Figure 6. Effect of temperature on bovine lens O2 and PO2
A, effect of temperature on O2 measured in lenses equilibrated with 5% oxygen. When the temperature of the bathing medium was reduced from 37°C to room temperature (20°C) or below, O2 fell dramatically. B and C, the PO2 and temperature of the lens core were recorded as the temperature of the medium was alternated between 37°C and room temperature (∼20°C). Fluctuations in the temperature of the bathing medium are paralleled (after a delay of approximately 1 h) by oscillations in core PO2.

Similar articles

Cited by

References

    1. Bantseev VL, Herbert KL, Trevithick JR, Sivak JG. Mitochondria of rat lenses: distribution near and at the sutures. Curr Eye Res. 1999;19:506–516. - PubMed
    1. Barbazetto IA, Liang J, Chang S, Zheng L, Spector A, Dillon JP. Oxygen tension in the rabbit lens and vitreous before and after vitrectomy. Exp Eye Res. 2004;78:917–924. - PubMed
    1. Bassnett S. Intracellular pH regulation in the embryonic chicken lens epithelium. J Physiol. 1990;431:445–464. - PMC - PubMed
    1. Bassnett S. Lens organelle degradation. Exp Eye Res. 2002;74:1–6. - PubMed
    1. Bassnett S, Beebe DC. Coincident loss of mitochondria and nuclei during lens fiber cell differentiation. Dev Dyn. 1992;194:85–93. - PubMed

Publication types

LinkOut - more resources