Comparative Study
. 2004 Nov 1;560(Pt 3):639-57.
doi: 10.1113/jphysiol.2004.065425. Epub 2004 Jul 22.

Neurotransmitter modulation of extracellular H+ fluxes from isolated retinal horizontal cells of the skate

Affiliations
Comparative Study

Neurotransmitter modulation of extracellular H+ fluxes from isolated retinal horizontal cells of the skate

Anthony J A Molina et al. J Physiol. .

Abstract

Self-referencing H(+)-selective microelectrodes were used to measure extracellular H(+) fluxes from horizontal cells isolated from the skate retina. A standing H(+) flux was detected from quiescent cells, indicating a higher concentration of free hydrogen ions near the extracellular surface of the cell as compared to the surrounding solution. The standing H(+) flux was reduced by removal of extracellular sodium or application of 5-(N-ethyl-N-isopropyl) amiloride (EIPA), suggesting activity of a Na(+)-H(+) exchanger. Glutamate decreased H(+) flux, lowering the concentration of free hydrogen ions around the cell. AMPA/kainate receptor agonists mimicked the response, and the AMPA/kainate receptor antagonist 6-cyano-7-nitroquinoxaline-2,3-dione (CNQX) eliminated the effects of glutamate and kainate. Metabotropic glutamate agonists were without effect. Glutamate-induced alterations in H(+) flux required extracellular calcium, and were abolished when cells were bathed in an alkaline Ringer solution. Increasing intracellular calcium by photolysis of the caged calcium compound NP-EGTA also altered extracellular H(+) flux. Immunocytochemical localization of the plasmalemma Ca(2+)-H(+)-ATPase (PMCA pump) revealed intense labelling within the outer plexiform layer and on isolated horizontal cells. Our results suggest that glutamate modulation of H(+) flux arises from calcium entry into cells with subsequent activation of the plasmalemma Ca(2+)-H(+)-ATPase. These neurotransmitter-induced changes in extracellular pH have the potential to play a modulatory role in synaptic processing in the outer retina. However, our findings argue against the hypothesis that hydrogen ions released by horizontal cells normally act as the inhibitory feedback neurotransmitter onto photoreceptor synaptic terminals to create the surround portion of the centre-surround receptive fields of retinal neurones.


Figures
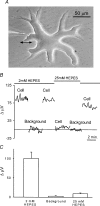
Figure 1
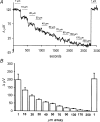
Figure 1. Self-referencing recordings from isolated skate horizontal cells using a H+-selective microelectrode
A, an isolated cell obtained via enzymatic dissociation from the retina of the skate. The large size and thick cell soma permit ready identification of this cell as an external horizontal cell (Malchow et al. 1990). To the left is shown a H+-selective microelectrode positioned in the ‘near pole’ recording position. Differential recordings were made by laterally translating the electrode to a position 50 μm distant from the cell and computing the difference in signal between the near and far poles of the recording. The double arrow indicates the movement from near to far positions. B, a self-referencing differential recording from a single horizontal cell. The differential signal with the cell bathed in a skate Ringer solution containing 2 mm of the pH buffer Hepes was approximately 85 μV. Moving the electrode 250 μm (Background) resulted in a differential response close to 0 μV. Moving the electrode back to its original position restored the 85 μV signal. The solution was then replaced by one containing 25 mm Hepes; recording at the same location resulted now in a much smaller signal. This signal was still larger than that obtained at a background location in the same 25 mm Hepes solution. Replacing the solution with one containing 2 mm Hepes brought the signal near its original amplitude. C, average results from eight cells; recordings were first made with the cell bathed in 2 mm Hepes and the electrode 1 μm from the cell membrane. Differential recordings were then obtained at a position at least 250 μm from the cell (Background). The solution around the cell was then changed to one containing 25 mm Hepes and the response recorded at the original position of the electrode near the cell.
Figure 2
Figure 2. Signal size as a function of distance of the electrode away from the cell membrane
A, recording obtained from a single cell. The numbers above the trace indicate the distance of the electrode tip from the cell membrane with the electrode in the near-pole recording position. The solution contained 2 mm Hepes. B, average responses as a function of distance obtained from six cells.
Figure 3
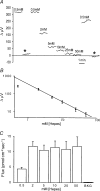
Figure 3. Dependence of signal size as a function of the concentration of the pH buffer Hepes
A, recordings from a single horizontal cell. Recordings were initially obtained with the cell bathed in 0.5 mm Hepes and the electrode tip 1 μm from the cell membrane. At the asterisk the electrode was moved 250 μm from the cell and a background reading obtained. Moving the electrode back close to the cell brought the signal to its original level. The solution in the dish was then replaced with solution containing different concentrations of Hepes while keeping the electrode in its original position. Breaks in the traces represent times when the solution was being replaced, which typically took 30 s to 1 min to accomplish. B, log of the electrode response plotted as a function of the log of the concentration of Hepes. Average responses obtained from eight cells using the same method of recording as in A. C, conversion of electrode response to H+ flux taking into account absorbtion of H+ by the pH buffer in the bath.
Figure 4
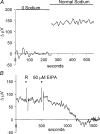
Figure 4. Effects of extracellular sodium and the Na+–H+ exchange blocker EIPA on H+ flux
A, removing extracellular sodium abolished the standing H+ flux. The trace shows a recording from one cell first in a solution in which all sodium had been replaced by NMDG, then in normal extracellular solution containing 270 mm sodium. Full exchange of the solution was accomplished over 1 min. B, the Na+–H+ exchange inhibitor EIPA abolished the standing H+ flux. Initial application of 1 ml of skate Ringer solution (R) was without effect (the rapid ‘spike-like’ changes are artifacts of solution application). Subsequent application of 1 ml solution containing EIPA (final concentration 50 μm) eliminated the differentially recorded signal.
Figure 5
Figure 5. Glutamate-induced alterations in H+ flux
A, responses obtained from a single horizontal cell. Application of 1 ml Ringer solution (R) did not alter measured H+ flux. A subsequent 1 ml application of the same solution containing glutamate (final concentration, 300 μm) produced a sharp decrease in H+ flux, which partially recovered with time. The electrode was moved, as indicated by the asterisks, to a background position 250 μm away from the cell. Addition of 1 mm glutamate to the bath had no additional effect. B, average responses to 300 μm glutamate obtained from eight cells showing the maximum alteration just after the application of glutamate and the response obtained 2 and 4 min later. C, dose-dependence of glutamate-induced alterations in measured H+ flux. Each bar is indicative of the response of six cells. Each cell was exposed to only one glutamate concentration. Values have been normalized to the responses obtained just prior to the application of glutamate. D, voltage changes induced by glutamate recorded in six separate horizontal cells obtained using sharp microelectrodes.
Figure 6
Figure 6. Alterations in H+ flux induced by the ionotropic glutamate analogue kainate
A, responses from a single cell showing the alteration in H+ flux that occurred upon the addition of 1 ml of Ringer solution alone (R), then with solution containing kainate (final concentration, 20 μm), and upon further addition of glutamate to a final concentration of 1 mm. Asterisks show recordings obtained with the electrode moved to a background location 250 μm away from the cell. B, average responses to kainate obtained from eight cells. C, responses from a single horizontal cell to 1 ml additions of normal saline solution and kainate (final concentration, 20 μm) in the presence of 100 μm CNQX. Asterisk again indicates recording obtained 250 μm from the cell. D, metabotropic glutamate receptor analogues did not alter H+ flux measured from horizontal cells. Responses obtained from a single cell to 1 ml normal extracellular solution and 1 ml solutions containing DHPG (final concentration, 100 μm) and 1 mm glutamate. Neither saline solution alone nor DHPG altered H+ flux, while glutamate produced a significant alteration in the measured signal.
Figure 7
Figure 7. Alteration of H+ flux by glutamate requires the presence of extracellular calcium
Recording from a single cell bathed initially in a solution in which the 4 mm calcium normally present had been replaced by 4 mm magnesium. The first ‘R’ denotes application of 1 ml skate Ringer solution containing nominally 0 mm calcium. The addition of 300 μm glutamate now produced no change in H+ flux from the cell. At about 1250 s, the recording was halted and the solution in the dish exchanged for one containing normal 4 mm calcium. At the second ‘R’, 1 ml of normal skate Ringer solution was added to the dish; this was followed by a 1 ml drop of glutamate (final concentration, 300 μm), which produced the typical change in H+ flux expected. Asterisks denote recordings from background locations 250 μm away from the cell.
Figure 8
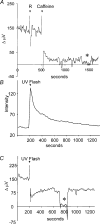
Figure 8. Effects of caffeine and release of caged calcium on H+ flux
A, effects of caffeine on H+ flux. Recording from a single cell in normal extracellular solution. This solution (1 ml) did not disturb the H+gradient, but 5 mm caffeine promoted a significant change in the measured signal. B, increase in fluorescence of the calcium indicator dye Oregon Green in a cell containing the caged calcium compound NP-EGTA. At 200 s into the recording, the cell was stimulated with a bright UV light stimulus for 100 ms. Y axis is in arbitrary units. C, self-referencing H+ recording made simultaneously from the same cell. The same ultraviolet flash resulted in a decrease in H+ flux. The asterisk denotes the differential response obtained when the electrode was placed at a background location 250 μm away from the cell membrane.
Figure 9
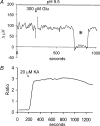
Figure 9. Alkalinization of the external solution abolished the ability of glutamate to alter H+ flux from horizontal cells
A, recording from one cell bathed in a solution adjusted to have an extracellular pH of 9.5. Application of 300 μm glutamate now failed to alter H+ flux. B, measurement of fura-2 fluorescence to examine calcium increases in horizontal cells when bathed in Ringer solution at pH 9.5. Addition of kainate at 20 μm produced a sizable increase in the ratio of 334 nm/380 nm fluorescence, indicating a significant increase in intracellular calcium.
Figure 10
Figure 10. Kainate acidifies the intracellular milieu of skate horizontal cells. Intracellular pH levels were monitored using the pH indicator dye BCECF
A, kainate (20 μm) produced a decrease in the ratio of fluorescence induced by stimulation with 488 and 460 nm light when cells were bathed in normal extracellular solution containing 4 mm calcium. Responses labelled pH 7, 9 and 5 are calibrations performed on the same cell bathed in nigericin. B, recording from a different horizontal cell showing that kainate does not alter intracellular pH when the solution lacks extracellular calcium.
Figure 11
Figure 11. Immunocytochemical localization of the plasmalemma Ca2+–H+-ATPase protein in isolated retina and isolated horizontal cells
A, staining pattern of fluorescence in a transverse section through the skate retina. Intense staining is distinctly visible at the level of the outer synaptic layer; lighter staining is evident within the inner synaptic layer. B, control section showing florescence seen in the absence of the primary antibody. C, confocal optical section through a single external horizontal cell stained for the plasmalemma Ca2+–H+-ATPase. Note the bright staining observed along the edges of the cell membrane. D, optical stack showing complete staining pattern for the same horizontal cell as shown in C. Note the intense staining on the cell membrane surface. E, control photomicrograph of a horizontal cell in which the primary antibody was omitted during the staining procedure. Scale bars are 10 μm for A and B, 35 μm for CE.

Similar articles

Cited by

References

    1. Ammann D, Oesch U, Buhrer T, Simon W. Design of ionophores for ion-selective microsensors. Can J Physiol Pharmacol. 1987;65:879–884. - PubMed
    1. Arif I, Newman IA, Keenylside N. Proton flux measurements from tissues in buffered solution. Plant Cell Environ. 1995;18:1319–1324.
    1. Ayoub GS, Dorst K. Imaging of glutamate release from the goldfish retinal slice. Vision Res. 1998;38:2909–2912. 10.1016/S0042-6989(98)00103-5. - DOI - PubMed
    1. Barnes S, Merchant V, Mahmud F. Modulation of transmission gain by protons at the photoreceptor output synapse. Proc Natl Acad Sci U S A. 1993;90:10081–10085. - PMC - PubMed
    1. Baylor DA, Fuortes MG, O'Bryan PM. Receptive fields of cones in the retina of the turtle. J Physiol. 1971;214:265–294. - PMC - PubMed

Publication types

LinkOut - more resources