. 2004 Oct 1;560(Pt 1):37-49.
doi: 10.1113/jphysiol.2004.065003. Epub 2004 Jul 22.

State-dependent trapping of flecainide in the cardiac sodium channel

Affiliations

State-dependent trapping of flecainide in the cardiac sodium channel

Eugene Ramos et al. J Physiol. .

Abstract

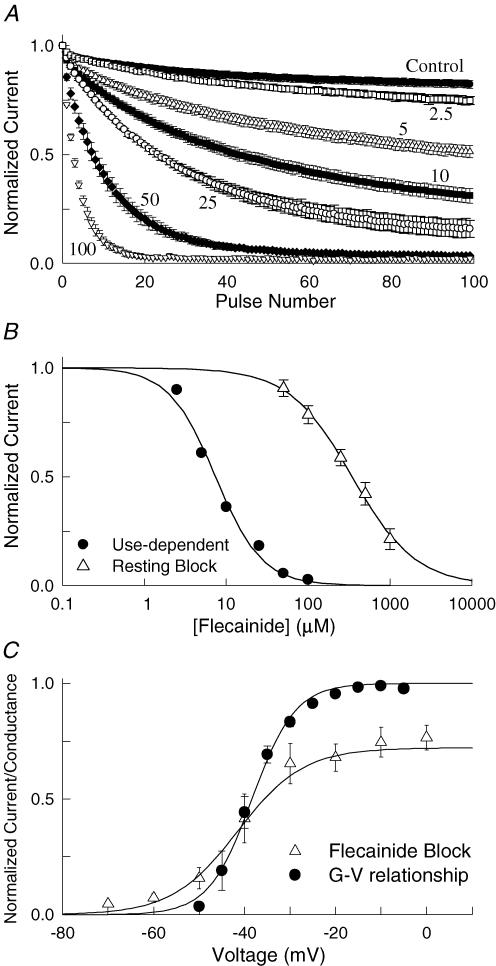
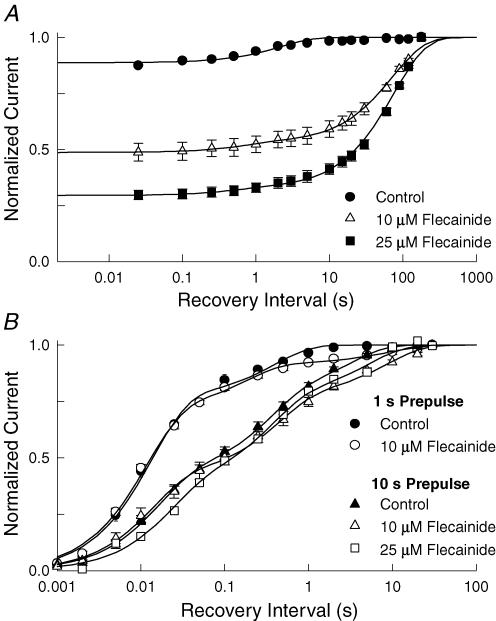
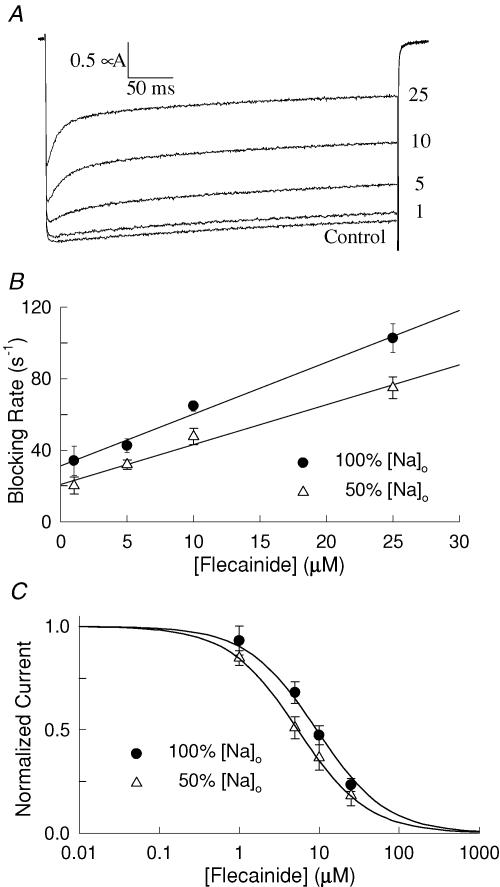
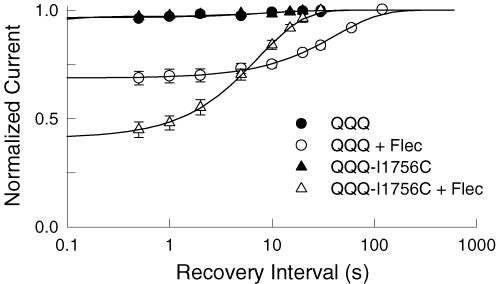
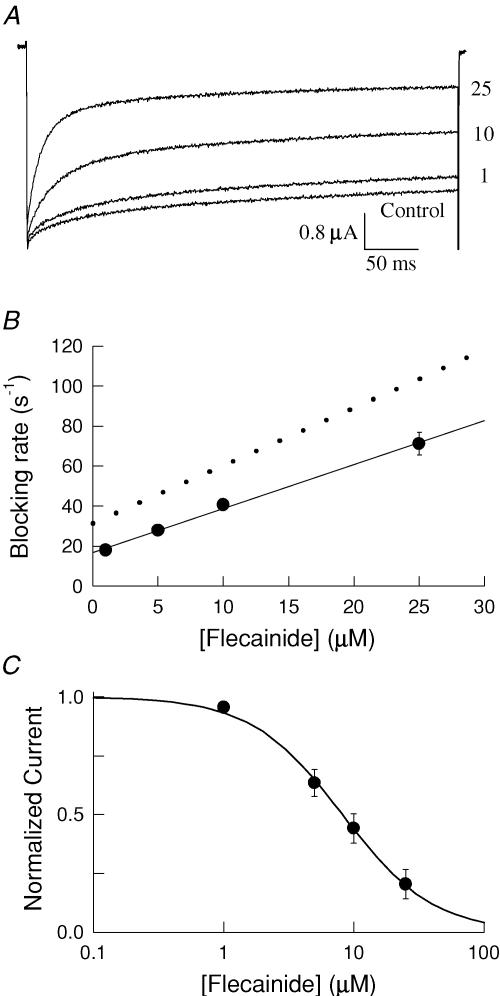
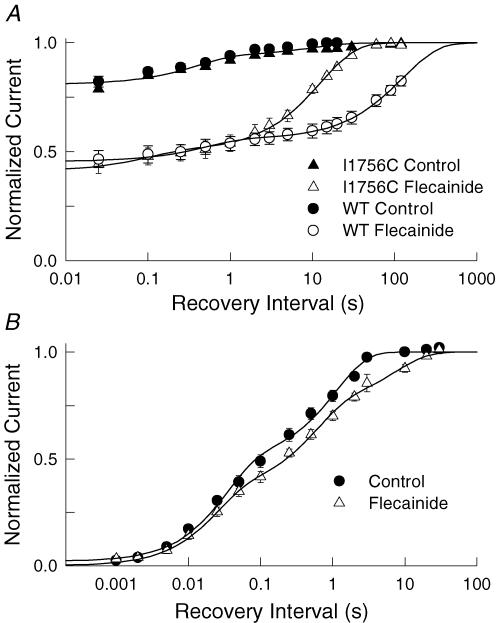
Flecainide is a Class I antiarrhythmic drug and a potent inhibitor of the cardiac (Nav1.5) sodium channel. Although the flecainide inhibition of Nav1.5 is typically enhanced by depolarization, the contributions of the open and inactivated states to flecainide binding and inhibition remain controversial. We further investigated the state-dependent binding of flecainide by examining its inhibition of rapidly inactivating and non-inactivating mutants of Nav1.5 expressed in Xenopus oocytes. Applying flecainide while briefly depolarizing from a relatively negative holding potential resulted in a low-affinity inhibition of the channel (IC(50) = 345 microM). Increasing the frequency of stimulation potentiated the flecainide inhibition (IC(50) = 7.4 microM), which progressively increased over the range of voltages where Nav1.5 channels activated. This contrasts with sustained depolarizations that effectively stabilize the channels in inactivated states, which failed to promote significant flecainide inhibition. The voltage sensitivity and strong dependence of the flecainide inhibition on repetitive depolarization suggests that flecainide binding is facilitated by channel opening and that the drug does not directly bind to closed or inactivated channels. The binding of flecainide to open channels was further investigated in a non-inactivating mutant of Nav1.5. Flecainide produced a time-dependent decay in the current of the non-inactivating mutant that displayed kinetics consistent with a simple pore blocking mechanism (K(D) = 11 microM). At hyperpolarized voltages, flecainide slowed the recovery of both the rapidly inactivating (tau = 81 +/- 3 s) and non-inactivating (tau = 42 +/- 3 s) channels. Mutation of a conserved isoleucine of the D4S6 segment (I1756C) creates an alternative pathway that permits the rapid diffusion of anaesthetics out of the Nav1.5 channel. The I1756C mutation accelerated the recovery of both the rapidly inactivating (tau = 12.6 +/- 0.4 s) and non-inactivating (tau = 7.4 +/- 0.1 s) channels, suggesting that flecainide is trapped and not tightly bound within the pore when the channels are closed or inactivated. The data indicate that flecainide rapidly gains access to its binding site when the channel is open and inhibits Na(+) current by a pore blocking mechanism. Closing of either the activation or the inactivation gate traps flecainide within the pore resulting in the slow recovery of the drug-modified channels at hyperpolarized voltages.


Figures

Figure 1
Figure 1. Flecainide preferentially inhibits activated states of Nav1.5
A, use-dependent inhibition was induced by applying a train of 100 depolarizing pulses (−10 mV, 20 ms) at a frequency of 10 Hz. The currents were measured before (Control) and 5 min after application of flecainide (2.5–100 μm). B, the steady-state current measured after 100 pulses (I100/I1) in the presence of flecainide was normalized to the drug-free control and plotted versus the flecainide concentration (Use-dependent). Also plotted is the resting block determined from single depolarizing pulses (−10 mV, 20 ms) applied at 60 s intervals from a holding potential of −120 mV (Resting Block). The continuous curves are a fit to the Hill equation [(I/Io = (1 + ([Flec]/IC50)(n)−1] where I and Io are the control and drug-modified current amplitudes and n is the Hill coefficient. The IC50 and n values are 7.4 ± 0.6 μm and 1.5 ± 0.2 for the use-dependent block (n = 5) and 345 ± 15 μm and 1.1 ± 0.06 for the resting block (n = 6). C, the voltage dependence of the flecainide inhibition (25 μm) was determined by varying the voltage of the pulses applied during repetitive stimulation (100 pulses, 10 Hz). The normalized steady-state inhibition after 100 pulses was determined and the fractional inhibition (1 − IFlec/ICont) plotted versus the test voltage. Also plotted is the normalized conductance versus voltage (GV) relationship determined by briefly depolarizing (20 ms) to voltages between −70 and −5 mV. The conductance at each voltage (GV) was calculated (GV = INa/(VVr), where Vr = reversal potential), normalized to the conductance measured at −10 mV (Go) and plotted versus the test voltage (V). The continuous curves are fits to the Boltzmann equation (G/Go = Max/(1 + exp(V0.5V)/k))) with a midpoint (V0.5) of −42 ± 1.0 mV and maximal inhibition (Max) of 75 ± 2% for the flecainide block (n = 5) and V0.5 for the current–voltage relationship measured in the presence of flecainide (25 μm) of −36 ± 0.9 mV (n = 4).
Figure 2
Figure 2. Flecainide slows the recovery of Nav1.5 channels
A, flecainide inhibition was induced by applying 100 depolarizing pulses (−10 mV, 20 ms) at a frequency of 10 Hz. The voltage was then returned to −100 mV for a variable duration (0.025–180 s) before applying a standard test pulse (−10 mV, 20 ms). The peak current amplitudes (I) elicited by test pulses were normalized to the current measured after a prolonged rest (180 s) at −100 mV (Io) and plotted versus the recovery interval. The continuous curves are fits to either a single or biexponential function [I/Io = 1 − (A1(t1) + A2(t2)] where τ and A are the time constants and the corresponding relative amplitudes. The data had time constants (relative amplitude) of 2.5 ± 0.3 s (A = 0.11 ± 0.01) for the control (n = 12), τ1 = 0.7 ± 0.2 s (A1 = 0.04 ± 0.01) and τ2 = 75.3 ± 4.5 s (A2 = 0.47 ± 0.01) for 10 μm (n = 5), and τ1 = 0.4 ± 0.1 s (A1 = 0.02 ± 0.02) and τ2 = 81.3 ± 3.2 s (A2 = 0.75 ± 0.01) for 25 μm flecainide (n = 6). B, channels were inactivated by applying 1 or 10 s depolarizing pulses to −10 mV before returning to −100 mV for a variable duration (1 ms–30 s). A standard test pulse (−10 mV, 20 ms) was used to assay the fractional current (I), which was normalized to the current measured after holding at −100 mV for 120 s (Io) and plotted versus the recovery interval (t). The continuous curves are fits of the data to either the sum of three exponential components [I/Io = 1 − (A1 exp(− t1) + A2 exp(− t2) + A3 exp(− t3))] where τ1 − τ3 are the recovery time constants and A1A3 are the corresponding relative amplitudes. The fitted parameters are listed in Table 1.
Figure 3
Figure 3. Flecainide inhibition of a non-inactivating mutant of Nav1.5A
The non-inactivating (QQQ) mutant channels (see text) were expressed in oocytes and current elicited by depolarizing to −10 mV for 400 ms from a holding potential of −100 mV. Flecainide (1–25 μm) induced a time-dependent decay in the current in the otherwise slowly inactivating current. B, the flecainide-induced decay was fitted with either one (control) or the sum of two (flecainide) exponentials and the effective blocking rate (1/τf) plotted versus the flecainide concentration. The straight lines are consistent with a bimolecular interaction with slope (kon) and y-intercept (koff). Also plotted is the blocking rate measured after reducing the external concentration of Na+ by 50%. The association and dissociation rate constants and the blocking affinity (KD = koff/kon) are listed in Table 2. C, the steady-state current measured near the end of the depolarizing pulses was normalized to the current of drug-free controls and plotted versus flecainide concentration. The continuous curves are fits to a single-site binding model [(I/Io = (1 + [flecainide]/KD)−1] with equilibrium constants (KD) of 11.2 ± 1.3 μm (n = 7) and 4.1 ± 0.7 μm (n = 6) for 100 and 50% external Na+, respectively.
Figure 4
Figure 4. I1756C accelerates the recovery of the flecainide-blocked QQQ mutant
Flecainide block was induced by applying a 100 ms depolarizing pulse to −10 mV before returning to −100 mV for a variable duration (0.5–120 s). A standard test pulse (−10 mV, 150 ms) was then used to assay availability. The test current amplitudes were normalized to control currents measured after 120 s (QQQ) or 30 s (QQQ-I1756C) of rest at −100 mV and plotted versus the recovery interval. The continuous curves are exponential fits with time constants (relative amplitudes) of τ = 9.2 ± 3.6 s (A = 0.03 ± 0.005) for the control (n = 14) and τ = 42.4 ± 2.6 s (A = 0.31 ± 0.005) after application of 25 μm flecainide (n = 7). Also plotted is the recovery of the QQQ-I1756C mutant which had time constants (relative amplitude) of τ = 11.9 ± 3.0 s (A = 0.03 ± 0.003) for the control (n = 14) and τ = 7.4 ± 0.1 s (A = 0.59 ± 0.005) for 25 μm flecainide (n = 9).
Figure 5
Figure 5. Flecainide block of the QQQ-I1756C mutant
A, current of the QQQ-I1756C mutant channels before and after bath application of flecainide (1–25 μm). Currents were elicited by depolarizing to −10 mV for 400 ms from a holding potential of −100 mV. The decay of the current was fitted with either one (control) or the sum of two exponential components (flecainide). B, the effective blocking rates (1/τf) were plotted versus the flecainide concentration. The association and dissociation rate constants are listed in Table 2. The dotted line is a regression fit describing the blocking kinetics of the QQQ mutant measured in 100% Na+ redrawn from Fig. 3B. C, the current measured at the end of the 400 ms depolarizing pulses (A) was normalized to drug-free controls and plotted versus the flecainide concentration. The continuous curve is a fit of the data to a single site model with KD of 8.5 ± 1.5 μm (n = 8).
Figure 6
Figure 6. I1756C accelerates the recovery of rapidly inactivating channels
A, the recovery time course of the rapidly inactivating wild type and I1756C mutant were measured by applying 100 depolarizing pulses at a frequency of 10 Hz. The voltage was then returned to −120 mV for a variable interval (0.02–90 s) before applying a standard test pulse (−10 mV, 20 ms). The amplitude of the test current was normalized to controls measured after 180 s rest at the holding potential and plotted versus the recovery interval. In the absence of drug the recovery of the wild type (n = 9) and I1756C mutant (n = 5) was biexponential with time constants (relative amplitude) of τf = 0.39 ± 0.10 s (Af = 0.13 ± 0.01) and τs = 10.3 ± 4.2 s (As = 0.06 ± 0.01). After application of flecainide (10 μm) the wild type had τf = 1.2 ± 0.1 s (Af = 0.10 ± 0.005) and τs = 127.6 ± 8.8 s (As = 0.44 ± 0.004) (n = 7). For the I1756C mutant the time constants were τf = 0.10 ± 0.03 s (Af = 0.09 ± 0.01) and τs = 12.6 ± 0.4 s (As = 0.50 ± 0.01) after application of flecainide (n = 5). B, recovery time course of the I1756C mutation. The recovery was determined by first applying a 10 s depolarizing pulse to −10 mV. The recovery time course (1 ms–60 s) was assessed using a standard test pulse. Test currents were normalized to controls measured after 120 s of rest at −120 mV. The continuous curves are biexponential curve fits with time constants (relative amplitude) of τf = 0.03 ± 0.005 s (Af = 0.47 ± 0.03) and τs = 1.1 ± 0.1 s (As = 0.50 ± 0.03) for controls (n = 3); τf = 0.05 ± 0.009 s (Af = 0.45 ± 0.03) and τs = 2.2 ± 0.3 s (As = 0.52 ± 0.03) after application of 25 μm flecainide (n = 3).

Similar articles

Cited by

References

    1. Anderson J, Gilbert E, Alpert B, Henthorn R, Waldo A, Bhandari A, Hawkinson R, Pritchett E. Prevention of symptomatic recurrences of paroxysmal atrial fibrillation in patients initially tolerating antiarrhythmic therapy. A multicenter, double-blind, crossover study of flecainide and placebo with transtelephonic monitoring. Flecainide Supraventricular Tachycardia Study Group. Circ. 1989;80:557–1570. - PubMed
    1. Anno T, Hondeghem L. Interactions of flecainide with guinea pig cardiac sodium channels. Importance of activation unblocking to the voltage dependence of recovery. Circ Res. 1990;66:89–803. - PubMed
    1. Bean B, Cohen C, Tsien R. Lidocaine block of cardiac sodium channels. J Gen Physiol. 1983;81:613–642. - PMC - PubMed
    1. Benhorin J, Taub R, Goldmit M, Kerem B, Kass R, Windman I, Medina A. Effects of flecainide in patients with new SCN5A mutation: mutation-specific therapy for long–QT syndrome? Circ. 2000;101:1698–1706. - PubMed
    1. Brugada R, Brugada J, Antzelevitch C, Kirsch G, Potenza D, Towbin J, Brugada P. Sodium channel blockers identify risk for sudden death in patients with ST-segment elevation and right bundle branch block but structurally normal hearts. Circ. 2000;101:510–515. - PubMed

Publication types

MeSH terms

LinkOut - more resources