

A major lung cancer susceptibility locus maps to chromosome 6q23-25
- PMID: 15272417
- PMCID: PMC1182024
- DOI: 10.1086/423857
A major lung cancer susceptibility locus maps to chromosome 6q23-25
Abstract
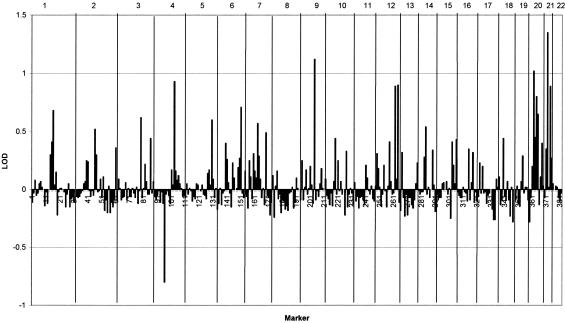
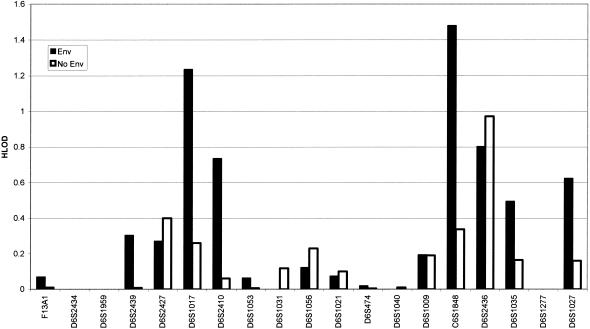
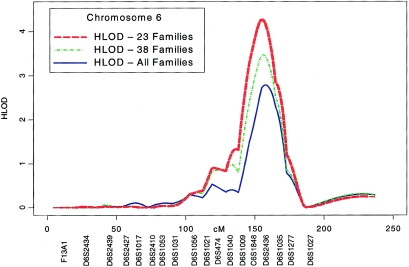
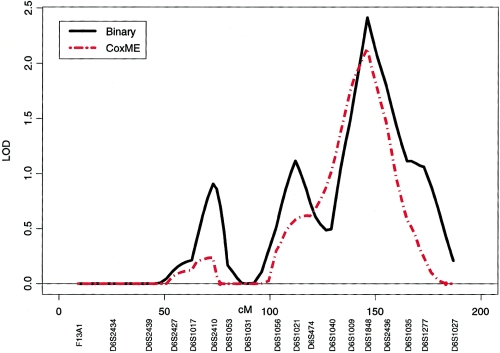
Lung cancer is a major cause of death in the United States and other countries. The risk of lung cancer is greatly increased by cigarette smoking and by certain occupational exposures, but familial factors also clearly play a major role. To identify susceptibility genes for familial lung cancer, we conducted a genomewide linkage analysis of 52 extended pedigrees ascertained through probands with lung cancer who had several first-degree relatives with the same disease. Multipoint linkage analysis, under a simple autosomal dominant model, of all 52 families with three or more individuals affected by lung, throat, or laryngeal cancer, yielded a maximum heterogeneity LOD score (HLOD) of 2.79 at 155 cM on chromosome 6q (marker D6S2436). A subset of 38 pedigrees with four or more affected individuals yielded a multipoint HLOD of 3.47 at 155 cM. Analysis of a further subset of 23 multigenerational pedigrees with five or more affected individuals yielded a multipoint HLOD score of 4.26 at the same position. The 14 families with only three affected relatives yielded negative LOD scores in this region. A predivided samples test for heterogeneity comparing the LOD scores from the 23 multigenerational families with those from the remaining families was significant (P=.007). The 1-HLOD multipoint support interval from the multigenerational families extends from C6S1848 at 146 cM to 164 cM near D6S1035, overlapping a genomic region that is deleted in sporadic lung cancers as well as numerous other cancer types. Parametric linkage and variance-components analysis that incorporated effects of age and personal smoking also supported linkage in this region, but with somewhat diminished support. These results localize a major susceptibility locus influencing lung cancer risk to 6q23-25.
Figures

References
Electronic-Database Information
-
- Center for Inherited Disease Research (CIDR), http://www.cidr.jhmi.edu
References
-
- Abe T, Makino N, Furukawa T, Ouyang H, Kimura M, Yatsuoka T, Yokoyama T, Inoue H, Fukushige S, Hoshi M, Hayashi Y, Sunamura M, Kobari M, Matsuno S, Horii A (1999) Identification of three commonly deleted regions on chromosome arm 6q in human pancreatic cancer. Genes Chromosomes Cancer 25:60–6410.1002/(SICI)1098-2264(199905)25:1<60::AID-GCC9>3.3.CO;2-P - DOI - PubMed
Publication types
MeSH terms
Substances
Grants and funding
- P30-ES06096/ES/NIEHS NIH HHS/United States
- R01 CA087895/CA/NCI NIH HHS/United States
- R01 CA60691/CA/NCI NIH HHS/United States
- N01 HG065403/HG/NHGRI NIH HHS/United States
- P50 CA058184/CA/NCI NIH HHS/United States
- P50 CA070907/CA/NCI NIH HHS/United States
- P50 058187/PHS HHS/United States
- R01 CA060691/CA/NCI NIH HHS/United States
- P41 RR003655/RR/NCRR NIH HHS/United States
- R01 CA637000/CA/NCI NIH HHS/United States
- R01 HL 71197/HL/NHLBI NIH HHS/United States
- N01 CN065064/CN/NCI NIH HHS/United States
- U01 CA076293/CA/NCI NIH HHS/United States
- U01 CA76293/CA/NCI NIH HHS/United States
- RR03655/RR/NCRR NIH HHS/United States
- R01 CA87895/CA/NCI NIH HHS/United States
- P30 ES006096/ES/NIEHS NIH HHS/United States
LinkOut - more resources
Full Text Sources
Other Literature Sources
Medical
Molecular Biology Databases
