Comparative Study
. 2004 Jul 23:5:100.
doi: 10.1186/1471-2105-5-100.

Graph-based iterative Group Analysis enhances microarray interpretation

Affiliations
Comparative Study

Graph-based iterative Group Analysis enhances microarray interpretation

Rainer Breitling et al. BMC Bioinformatics. .

Abstract

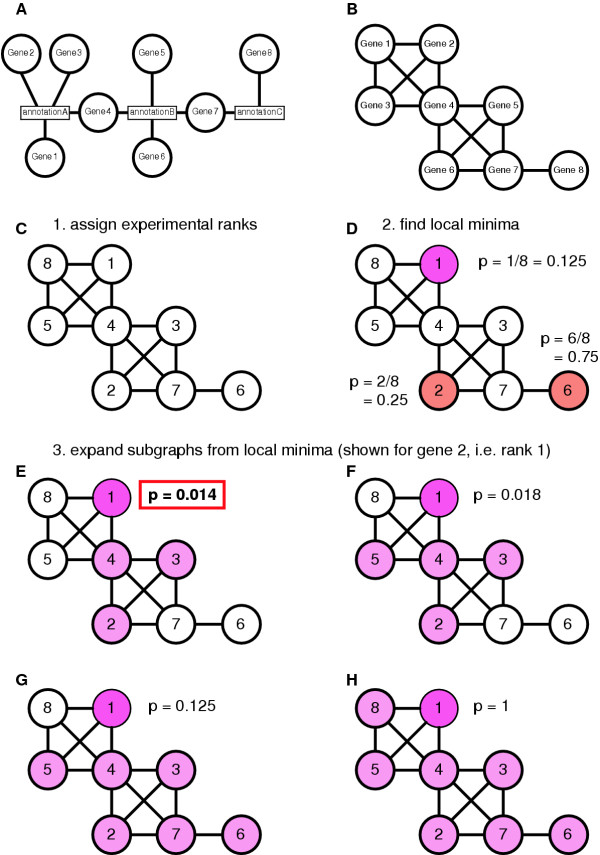
Background: One of the most time-consuming tasks after performing a gene expression experiment is the biological interpretation of the results by identifying physiologically important associations between the differentially expressed genes. A large part of the relevant functional evidence can be represented in the form of graphs, e.g. metabolic and signaling pathways, protein interaction maps, shared GeneOntology annotations, or literature co-citation relations. Such graphs are easily constructed from available genome annotation data. The problem of biological interpretation can then be described as identifying the subgraphs showing the most significant patterns of gene expression. We applied a graph-based extension of our iterative Group Analysis (iGA) approach to obtain a statistically rigorous identification of the subgraphs of interest in any evidence graph.

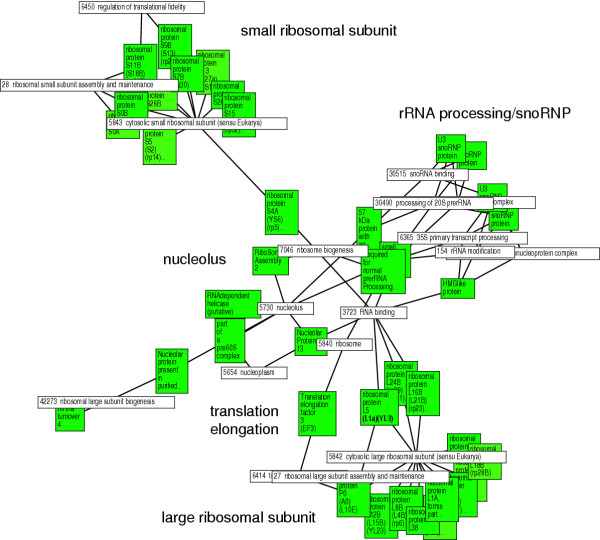
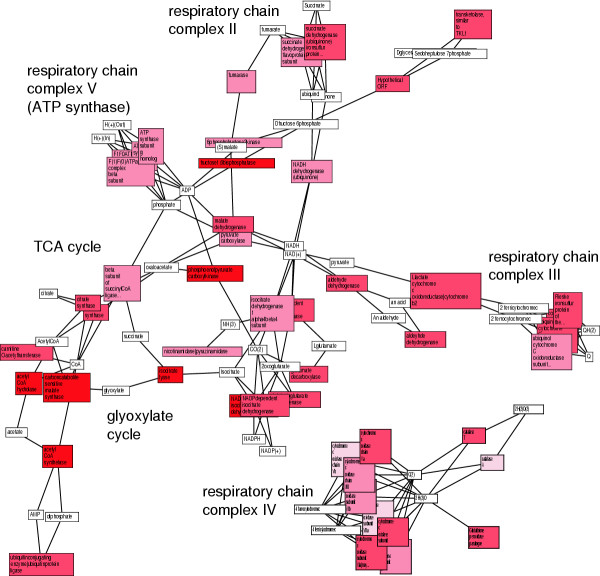
Results: We validated the Graph-based iterative Group Analysis (GiGA) by applying it to the classic yeast diauxic shift experiment of DeRisi et al., using GeneOntology and metabolic network information. GiGA reliably identified and summarized all the biological processes discussed in the original publication. Visualization of the detected subgraphs allowed the convenient exploration of the results. The method also identified several processes that were not presented in the original paper but are of obvious relevance to the yeast starvation response.

Conclusions: GiGA provides a fast and flexible delimitation of the most interesting areas in a microarray experiment, and leads to a considerable speed-up and improvement of the interpretation process.


Figures

Figure 1
Figure 1
Principle of Graph-based Iterative Group Analysis. A Evidence network. Genes are associated with their annotation in the form of a bigraph (two types of nodes). B The same evidence represented as a simple network. Genes that share an annotation are connected. C-H Example of a GiGA analysis using fictitious microarray results. C Genes are assigned their ranks based on observed expression changes. D Local minima are found, i.e. genes that have no connection to genes with a better rank. E-H Iterative expansion of subgraphs from one of the local minima, gene 2 (rank 1). E The neighboring node with the smallest rank is included (gene 4, rank 4), which leads to the additional inclusion of genes 5 (rank 3) and 6 (rank 2). F Gene 3 (rank 5) is included). G Gene 7 (rank 7) is included, leading to the inclusion of gene 8 (rank 6). H The last gene reachable from this local minimum, gene 1 (rank 8), is included and the process terminates. For each of the subgraphs a p-value can be calculated (see text) and the subgraph with the smallest p-value is declared the "regulated neighborhood" of the local minimum. In the example, genes 2, 4, 5, and 6 form a regulated neighborhood (p = 0.014). The graph expansion process would then be repeated for the remaining two local minima.
Figure 2
Figure 2
Visualization of the most significant "down-regulated neighborhood" identified by GiGA using a GeneOntology-based network. The expression data are taken from the 20.5 h timepoint of the yeast diauxic shift (DeRisi et al., 1997). The layout was generated from the output of GiGA by the free software aiSee using a force-directed algorithm with default parameters. The same software can also be used for the versatile real-time navigation of the network. Colored boxes show the regulated genes (darker shading indicates stronger regulation), white boxes show the evidence linking the genes (in this case GeneOntology numbers and terms). Several important components of this regulatory neighborhood are indicated (small and large ribosomal subunit proteins, rRNA processing/snRNP, nucleolar proteins, translation elongation factors). These components were also identified in the original publication after manual analysis. GiGA finds them automatically, and also detects the – biologically obvious – connections between them. As all the evidence is included in the same picture, the biologist can then use her expertise to assess the relevance of each link, without having to make the connections ad hoc by tedious literature studies.
Figure 3
Figure 3
Visualization of the two most significant "up-regulated neighborhoods" identified by GiGA using a metabolic network derived from Swissprot annotations. The expression data are taken from the 20.5 h timepoint of the yeast diauxic shift (DeRisi et al., 1997). The layout was generated as in Fig 2. Colored boxes show the regulated genes (darker shading indicates stronger regulation), white boxes show the substrates that are in common between genes. Important components of this regulatory neighborhood are indicated (TCA cycle and glyoxylate cycle enzymes, and the various respiratory chain complexes). Here it can be seen that GiGA not only detects protein complexes (such as ribosomes or the respiratory chain complexes), but also "linear" metabolic pathways such as TCA cycle and glyoxylate cycle (and potentially signal transduction pathways or regulatory cascades etc.). Almost all the enzymes discussed by DeRisi et al. (1997) are included in these two subgraphs, plus the relevant enzymatic information necessary to assess the relevance of each link, without the danger of missing some genes (unless the annotation is incomplete).

References

    1. Dudoit S, Yang YH, Callow MJ, Speed TP. Statistical methods for identifying differentially expressed genes in replicated cDNA microarray experiments. Statistica Sinica. 2002;12:111–139.
    1. Breitling R, Armengaud P, Amtmann A, Herzyk P. Rank products: A simple, yet powerful, new method to detect differentially regulated genes in replicated microarray experiments. FEBS Letters. - PubMed
    1. Breitling R, Amtmann A, Herzyk P. Iterative Group Analysis (iGA): A simple tool to enhance sensitivity and facilitate interpretation of microarray experiments. BMC Bioinformatics. 2004;5:34. doi: 10.1186/1471-2105-5-34. - DOI - PMC - PubMed
    1. Doniger SW, Salomonis N, Dahlquist KD, Vranizan K, Lawlor SC, Conklin BR. MAPPFinder: using Gene Ontology and GenMAPP to create a global gene-expression profile from microarray data. Genome Biol. 2003;4:R7. doi: 10.1186/gb-2003-4-1-r7. - DOI - PMC - PubMed
    1. Hosack DA, Dennis G., Jr., Sherman BT, Lane HC, Lempicki RA. Identifying biological themes within lists of genes with EASE. Genome Biol. 2003;4:R70. doi: 10.1186/gb-2003-4-10-r70. - DOI - PMC - PubMed

Publication types

MeSH terms

LinkOut - more resources