

Review
doi: 10.1128/AAC.48.8.2787-2792.2004.
Hazard ratio in clinical trials
Affiliations
- PMID: 15273082
- PMCID: PMC478551
- DOI: 10.1128/AAC.48.8.2787-2792.2004
Item in Clipboard
Review
Hazard ratio in clinical trials
Antimicrob Agents Chemother.
2004 Aug.
No abstract available
Figures
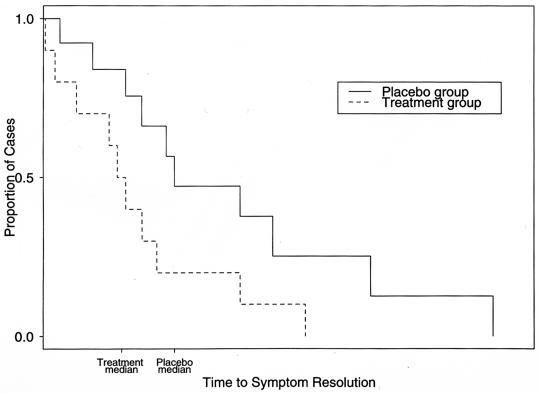
Kaplan-Meier curve. Time to symptom resolution is compared between treatment and placebo groups. HR, hazard rate ratio = treatment hazard rate/placebo hazard rate. The hazard ratio is constant under the Cox proportional hazard model. The P value is used to reject the null hypothesis that HR = 1, i.e., treatment is not beneficial. Median, time at which half the cases are resolved and half are not resolved. MR, median ratio = placebo median time/treatment median time. Mean, average resolution time (based on the area under the Kaplan-Meier curve).
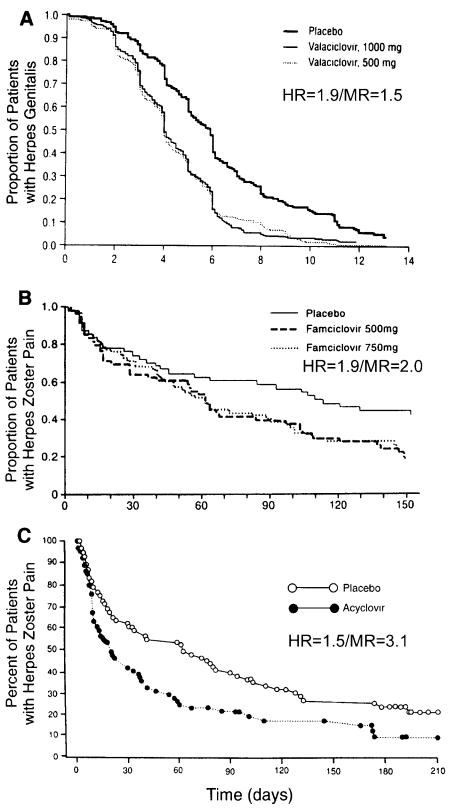
Examples of the variable relationship between the hazard ratio and median ratio with clinical trials of antiviral agents as examples. While more than one drug dose was tested in two of the examples, outcomes were similar, and the statistics shown could apply to either curve. (A) Effect of valaciclovir on length of recurrent herpes genitalis episodes (8); hazard ratio = 1.9 and median ratio = 1.5. (B) Effect of famciclovir on time to resolution of postherpetic neuralgia (9); hazard ratio = 1.9 and median ratio = 2.0. (C) Effect of acyclovir on time to resolution of postherpetic neuralgia (6, 11); hazard ratio = 1.5 and median ratio = 3.1. The graphs were adapted from the indicated references.
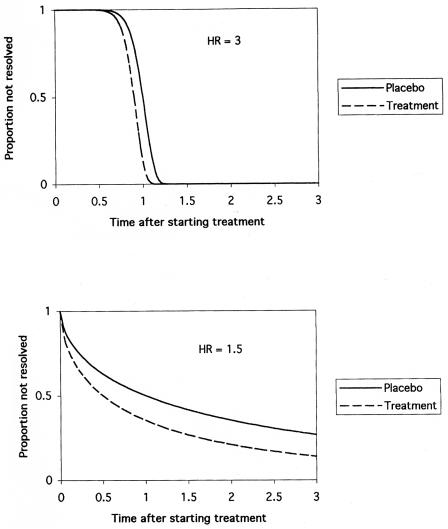
The hazard ratio can be misleading if used to assess the amount of treatment benefit. Benefits of therapy depend not only on the hazard ratio but also on the shape of the underlying probability distribution, which is disease related. The survival functions in this figure are Weibull distributions that are standardized so the median survival time of the placebo group is one time unit. Mean survival times for the placebo groups are 1.0 (top figure) and 2.9 (bottom figure) time units. (Top) A relatively large hazard ratio can yield small treatment effects. These sinusoidal survival curves have a hazard ratio of 3, but both median and mean survival times are reduced only 10% by treatment. Although treatment increases the hazard rate, the effect is concentrated over such a limited time period that the overall benefit is minimal. (Bottom) A relatively small hazard ratio, in contrast, can yield large treatment effects. These concave survival curves have a hazard ratio of only 1.5, but both median and mean survival times are reduced 50% by treatment.
References
-
- Allison, P. A. 1995. Survival analysis using the SAS system: a practical guide. SAS Institute, Inc., Cary, N.C.
-
- Cox, D. R. 1972. Regression models and life tables. J. R. Stat. Soc. B 34:187-220.
-
- Cox, D. R., and D. Oakes. 2001. Analysis of survival data. Chapman and Hall, London, England.
-
- Harrell, F. E., Jr., R. M. Califf, D. B. Pryor, K. L. Lee, and R. A. Rosati. 1982. Evaluating the yield of medical tests. JAMA 247:2543-2546. - PubMed
-
- Harrell, F. E., Jr., K. L. Lee, R. M. Califf, D. B. Pryor, and R. A. Rosati. 1984. Regression modelling strategies for improved prognostic function. Stat. Med. 3:143-152. - PubMed
Publication types
MeSH terms
Substances
LinkOut - more resources
Full Text Sources
Other Literature Sources
Medical
