. 2004 Aug 3;101(31):11227-32.
doi: 10.1073/pnas.0401882101. Epub 2004 Jul 23.

Molecular-timetable methods for detection of body time and rhythm disorders from single-time-point genome-wide expression profiles

Affiliations

Molecular-timetable methods for detection of body time and rhythm disorders from single-time-point genome-wide expression profiles

Hiroki R Ueda et al. Proc Natl Acad Sci U S A. .

Abstract

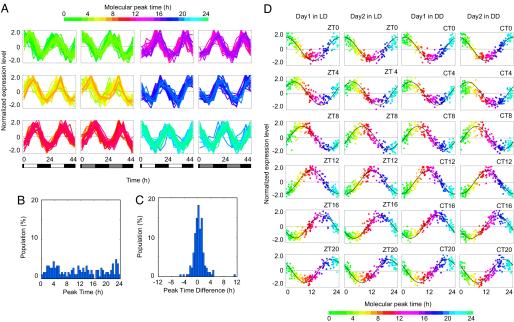
Detection of individual body time (BT) via a single-time-point assay has been a longstanding unfulfilled dream in medicine, because BT information can be exploited to maximize potency and minimize toxicity during drug administration and thus will enable highly optimized medication. To achieve this dream, we created a "molecular timetable" composed of >100 "time-indicating genes," whose gene expression levels can represent internal BT. Here we describe a robust method called the "molecular-timetable method" for BT detection from a single-time-point expression profile. The power of this method is demonstrated by the sensitive and accurate detection of BT and the sensitive diagnosis of rhythm disorders. These results demonstrate the feasibility of BT detection based on single-time-point sampling, suggest the potential for expression-based diagnosis of rhythm disorders, and may translate functional genomics into chronotherapy and personalized medicine.


Figures

Fig. 1.
Fig. 1.
Time-indicating genes in the mouse liver. (A) Temporal expression data of 168 time-indicating genes (182 probes) in the mouse liver. The colors, in ascending order from green to red to blue, represent the molecular peak time of time-indicating genes (the color code is represented above the diagrams). An expression level of each time-indicating gene is subtracted by its average and divided by its SD over 12-point time courses. The blocked horizontal bars below the diagrams correspond to the LD schedule. White blocks indicate periods of exposure to light, whereas black blocks correspond to periods of darkness, and gray blocks indicate the period of subjective light under constant darkness. (B) Distribution of the average of molecular peak time between LD and DD conditions. Average molecular peak times are distributed from 0 to 24 h. (C) Distribution of differences of molecular peak times between LD and DD conditions. Molecular peak times in LD and DD conditions are similar to each other. (D) Expression profiles of 168 time-indicating genes in the mouse liver at different ZT under LD conditions or CT under DD conditions. The best-fitted cosine curve is represented, and its peak indicates the estimated BT.
Fig. 2.
Fig. 2.
Significant and quantitative detection of BT from individual expression profiles at ZT12 (A) or ZT6, ZT18, CT6, and CT18 (B). The colors, in ascending order from green to red to blue, represent the molecular peak time of time-indicating genes (the color code is represented below the diagrams). An expression level of each time-indicating gene is subtracted by its average and divided by its SD in the molecular timetable. The best-fitted cosine curve is represented, and its peak indicates the estimated BT, BT12.8 (A Upper Left), BT10.2 (A Lower Left), BT11.2 (A Upper Right), and BT11.7 (A Lower Right), and BT6.7 (B Upper Left), BT19.3 (B Lower Left), BT5.7 (B Upper Right), and BT20.0 (B Lower Right).
Fig. 3.
Fig. 3.
Significant detection of BT and rhythm disorders from expression profiles of Clock/Clock mutant mice at ZT12 (A) and C3H mouse at ZT12 (B). The colors, in ascending order from green to red to blue, represent the molecular peak time of time-indicating genes (the color code is represented below the diagrams). An expression level of each time-indicating gene is subtracted by its average and divided by its SD in the molecular timetable. The best-fitted cosine curve is represented, and its peak indicates the estimated BT, BT12.3 (B Upper Left), BT11.3 (B Lower Left), and BT11.3 (B Lower Right).

References

    1. Reppert, S. M. & Weaver, D. R. (2002) Nature 418, 935–941. - PubMed
    1. Akhtar, R. A., Reddy, A. B., Maywood, E. S., Clayton, J. D., King, V. M., Smith, A. G., Gant, T. W., Hastings, M. H. & Kyriacou, C. P. (2002) Curr. Biol. 12, 540–550. - PubMed
    1. Panda, S., Antoch, M. P., Miller, B. H., Su, A. I., Schook, A. B., Straume, M., Schultz, P. G., Kay, S. A., Takahashi, J. S. & Hogenesch, J. B. (2002) Cell 109, 307–320. - PubMed
    1. Storch, K. F., Lipan, O., Leykin, I., Viswanathan, N., Davis, F. C., Wong, W. H. & Weitz, C. J. (2002) Nature 417, 78–83. - PubMed
    1. Ueda, H. R., Chen, W., Adachi, A., Wakamatsu, H., Hayashi, S., Takasugi, T., Nagano, M., Nakahama, K., Suzuki, Y., Sugano, S., et al. (2002) Nature 418, 534–539. - PubMed

Publication types