. 2004 Aug 3;101(31):11293-7.
doi: 10.1073/pnas.0404350101. Epub 2004 Jul 23.

Watching the photosynthetic apparatus in native membranes

Affiliations

Watching the photosynthetic apparatus in native membranes

Simon Scheuring et al. Proc Natl Acad Sci U S A. .

Abstract

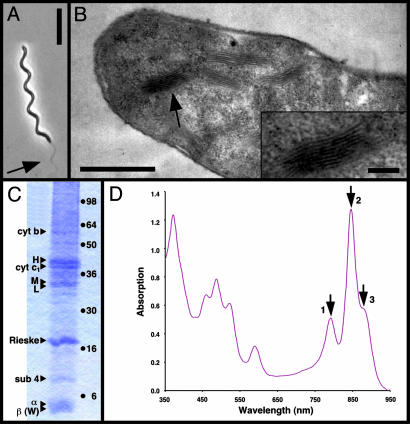
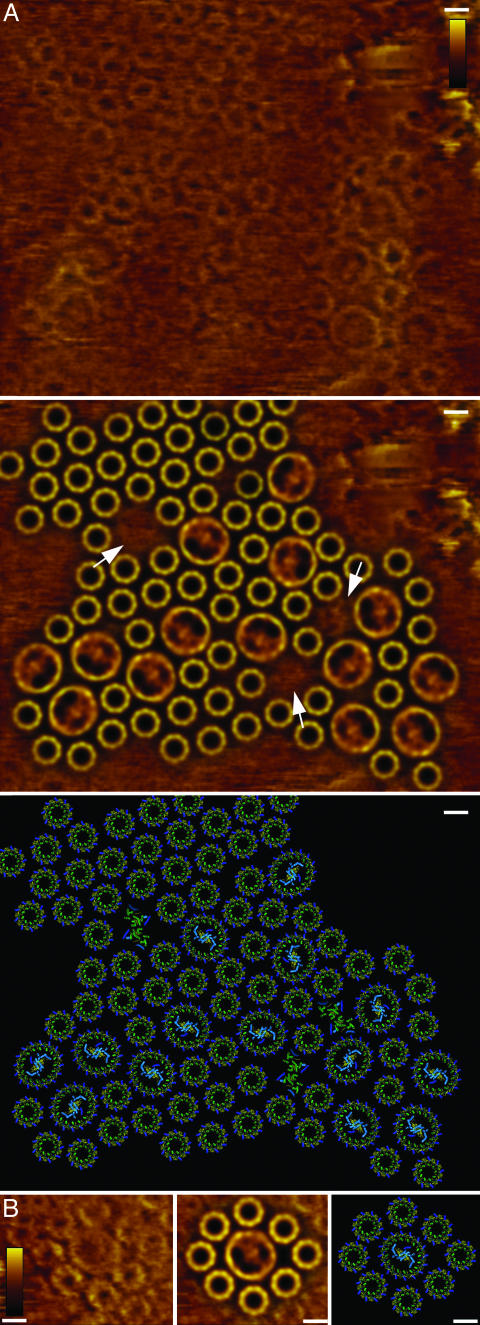
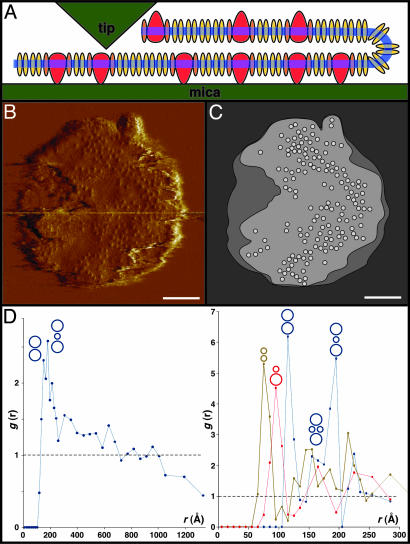
Over the last 9 years, the structures of the various components of the bacterial photosynthetic apparatus or their homologues have been determined by x-ray crystallography to at least 4.8-A resolution. Despite this wealth of structural information on the individual proteins, there remains an urgent need to examine the architecture of the photosynthetic apparatus in intact photosynthetic membranes. Information on the arrangement of the different complexes in a native system will help us to understand the processes that ensure the remarkably high quantum efficiency of the system. In this work we report images obtained with an atomic force microscope of native photosynthetic membranes from the bacterium Rhodospirillum photometricum. Several proteins can be seen and identified at molecular resolution, allowing the analysis and modeling of the lateral organization of multiple components of the photosynthetic apparatus within a native membrane. Analysis of the distribution of the complexes shows that their arrangement is far from random, with significant clustering both of antenna complexes and core complexes. The functional significance of the observed distribution is discussed.


Figures

Fig. 1.
Fig. 1.
Isolation of native membranes from Rsp. photometricum.(A) Phase contrast light microscopy image of Rsp. photometricum. Arrow points at the flagella. (Bar = 10 μm.) (B) Thin section transmission electron microscopy image of Rsp. photometricum. Arrow points at the stacked chromatophore membranes. (Bar = 1 μm.) (Inset) Stack of intracytoplasmic membranes (Bar = 200 nm.) (C) SDS/PAGE analysis of membrane components. Membranes were solubilized and separated on a 12% acrylamide gel before staining with Coomassie blue. Triangles on the left of the gel lane indicate attributions of bands based on molecular weight, haem staining, and partial purification of complexes; points on the right indicate the migration of standard proteins (SeeBlue, Invitrogen). (D) Absorption spectrum of isolated membranes. The three arrows indicate the near-infrared absorption maxima associated with bacteriochlorophyll Qy transitions of the LH2 at 791 nm (1) and 846 nm (2) and LH1 at 882 nm (3). Based on approximate extinction coefficients, the observed absorption spectrum corresponds to about seven LH2 complexes per core complex.
Fig. 3.
Fig. 3.
Molecular organization of the photosynthetic apparatus. (A Top) Raw-data AFM topograph of a native chromatophore membrane (full-color scale 3 nm). (A Middle) Fitting of the LH2 and core-complex averages corresponding to the relative positions and orientations in the topograph. (A Bottom) Fitting of the LH2 structure, a core-complex model, and a cytochrome bc1 dimer model, corresponding to the relative positions and orientations in the topograph. (B Left) Raw-data AFM topograph of an example of the organization of multiple LH2 around a core complex (full-color scale 3 nm). (B Center) Fitting of the LH2 and core-complex averages corresponding to the relative positions and orientations in the topograph. (B Right) Fitting of the LH2 structure, a core-complex model corresponding to the relative positions, and orientations in the topograph. (Bars = 5 nm.)
Fig. 2.
Fig. 2.
Protein distribution within the intracytoplasmic membrane. (A) Schematic presentation of the nanodissection of the membrane vesicles with the AFM tip (red, RC; orange, LH1; yellow, LH2). Before nanodissection of the upper membrane layer the vesicles exposed their cytoplasmic surface, both to the mica and to the tip. (B) AFM deflection image of an intra-cytoplasmic membrane vesicle. The separation of the top membrane from the bottom membrane by nanodissection is visible on the left edge of the vesicle. (Bar = 100 nm.) (C) Outline of the vesicle and position map of the RCs. (Bar = 100 nm.) (D) Graphs of the pair correlation function analysis calculated from overview data (Left) (core–core; n = 3,750 distances) and from the high-resolution data (Right) (LH2–LH2, green line, n = 485; core–LH2, red line, n = 162; and core–core, blue line, n = 49). This function is a measure of the probability of finding a particular type of complex at a certain distance from another complex; for a random distribution this gives a constant value of 1. For LH2–LH2, core–LH2, and core–core, discrete peaks corresponding to favored complex–complex interactions, as indicated by the sketches above the peaks, were found. The curves in Right were calculated from the image in Fig. 3A.

References

    1. Bibby, T., Nield, J., Partensky, F. & Barber, J. (2001) Nature 413, 590. - PubMed
    1. Abrahams, J. P., Leslie, A. G. W., Lutter, R. & Walker, J. E. (1994) Nature 370, 621–628. - PubMed
    1. Kühlbrandt, W. (1995) Nature 374, 497.
    1. Hu, X., Ritz, T., Damjanovic, A., Autenrieth, F. & Schulten, K. (2002) Q. Rev. Biophys. 35, 1–62. - PubMed
    1. Deisenhofer, J., Epp, O., Miki, K., Huber, R. & Michel, H. (1984) J. Mol. Biol. 180, 385–398. - PubMed

Publication types

MeSH terms

Substances

LinkOut - more resources