

Global transcription profiling reveals multiple sugar signal transduction mechanisms in Arabidopsis
- PMID: 15273295
- PMCID: PMC519203
- DOI: 10.1105/tpc.104.022616
Global transcription profiling reveals multiple sugar signal transduction mechanisms in Arabidopsis
Abstract
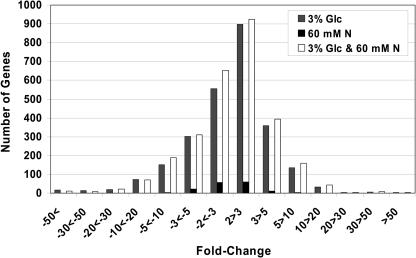
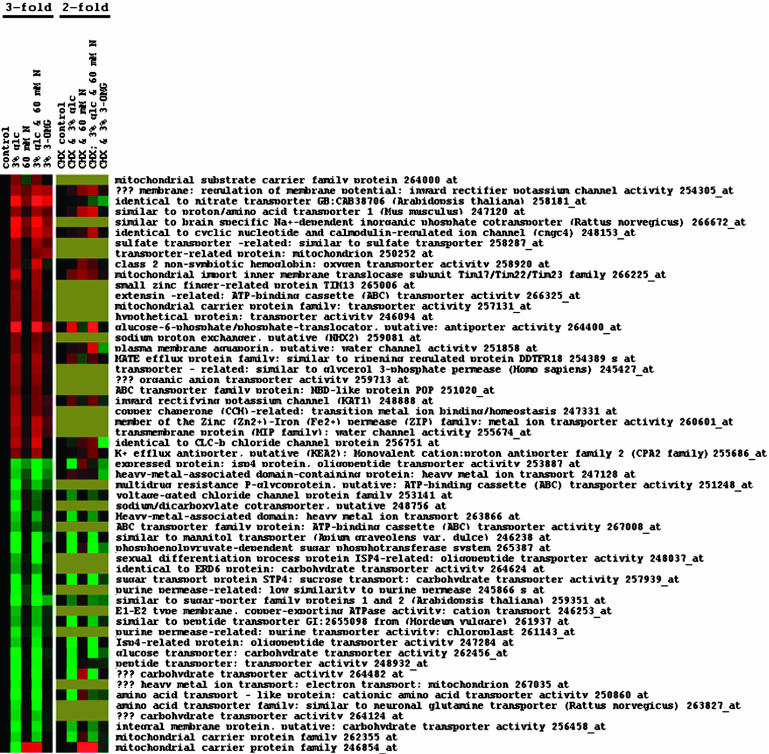
Complex and interconnected signaling networks allow organisms to control cell division, growth, differentiation, or programmed cell death in response to metabolic and environmental cues. In plants, it is known that sugar and nitrogen are critical nutrient signals; however, our understanding of the molecular mechanisms underlying nutrient signal transduction is very limited. To begin unraveling complex sugar signaling networks in plants, DNA microarray analysis was used to determine the effects of glucose and inorganic nitrogen source on gene expression on a global scale in Arabidopsis thaliana. In whole seedling tissue, glucose is a more potent signal in regulating transcription than inorganic nitrogen. In fact, other than genes associated with nitrate assimilation, glucose had a greater effect in regulating nitrogen metabolic genes than nitrogen itself. Glucose also regulated a broader range of genes, including genes associated with carbohydrate metabolism, signal transduction, and metabolite transport. In addition, a large number of stress responsive genes were also induced by glucose, indicating a role of sugar in environmental responses. Cluster analysis revealed significant interaction between glucose and nitrogen in regulating gene expression because glucose can modulate the effects of nitrogen and vise versa. Intriguingly, cycloheximide treatment appeared to disrupt glucose induction more than glucose repression, suggesting that de novo protein synthesis is an intermediary event required before most glucose induction can occur. Cross talk between sugar and ethylene signaling may take place on the transcriptional level because several ethylene biosynthetic and signal transduction genes are repressed by glucose, and the repression is largely unaffected by cycloheximide. Collectively, our global expression data strongly support the idea that glucose and inorganic nitrogen act as both metabolites and signaling molecules.
Figures


Similar articles
-
Effect of sugar-induced senescence on gene expression and implications for the regulation of senescence in Arabidopsis.Planta. 2006 Aug;224(3):556-68. doi: 10.1007/s00425-006-0243-y. Epub 2006 Mar 3. Planta. 2006. PMID: 16514542
-
Transcriptional profiling by cDNA-AFLP and microarray analysis reveals novel insights into the early response to ethylene in Arabidopsis.Plant J. 2004 Aug;39(4):537-59. doi: 10.1111/j.1365-313X.2004.02156.x. Plant J. 2004. PMID: 15272873
-
Transcriptional responses to polycyclic aromatic hydrocarbon-induced stress in Arabidopsis thaliana reveal the involvement of hormone and defense signaling pathways.BMC Plant Biol. 2010 Apr 7;10:59. doi: 10.1186/1471-2229-10-59. BMC Plant Biol. 2010. PMID: 20377843 Free PMC article.
-
Carbon and nitrogen sensing and signaling in plants: emerging 'matrix effects'.Curr Opin Plant Biol. 2001 Jun;4(3):247-53. doi: 10.1016/s1369-5266(00)00168-0. Curr Opin Plant Biol. 2001. PMID: 11312136 Review.
-
A systems view of nitrogen nutrient and metabolite responses in Arabidopsis.Curr Opin Plant Biol. 2008 Oct;11(5):521-9. doi: 10.1016/j.pbi.2008.07.003. Epub 2008 Sep 3. Curr Opin Plant Biol. 2008. PMID: 18775665 Review.
Cited by
-
Arabidopsis Hexokinase-Like1 and Hexokinase1 form a critical node in mediating plant glucose and ethylene responses.Plant Physiol. 2012 Apr;158(4):1965-75. doi: 10.1104/pp.112.195636. Epub 2012 Feb 24. Plant Physiol. 2012. PMID: 22366209 Free PMC article.
-
Transcriptome response to nitrogen starvation in rice.J Biosci. 2012 Sep;37(4):731-47. doi: 10.1007/s12038-012-9242-2. J Biosci. 2012. PMID: 22922198
-
Quantifying protein synthesis and degradation in Arabidopsis by dynamic 13CO2 labeling and analysis of enrichment in individual amino acids in their free pools and in protein.Plant Physiol. 2015 May;168(1):74-93. doi: 10.1104/pp.15.00209. Epub 2015 Mar 25. Plant Physiol. 2015. PMID: 25810096 Free PMC article.
-
Dynamic and diverse sugar signaling.Curr Opin Plant Biol. 2016 Oct;33:116-125. doi: 10.1016/j.pbi.2016.06.018. Epub 2016 Jul 14. Curr Opin Plant Biol. 2016. PMID: 27423125 Free PMC article. Review.
-
Glucose Uptake via STP Transporters Inhibits in Vitro Pollen Tube Growth in a HEXOKINASE1-Dependent Manner in Arabidopsis thaliana.Plant Cell. 2018 Sep;30(9):2057-2081. doi: 10.1105/tpc.18.00356. Epub 2018 Aug 17. Plant Cell. 2018. PMID: 30120167 Free PMC article.
References
-
- Bard, J.B., and Rhee, S.Y. (2004). Ontologies in biology: Design, applications and future challenges. Nat. Rev Genet 5, 213–222. - PubMed
Publication types
MeSH terms
Substances
LinkOut - more resources
Full Text Sources
Other Literature Sources
Molecular Biology Databases
