. 2004 Aug;16(8):2233-48.
doi: 10.1105/tpc.104.022657. Epub 2004 Jul 23.

The Ustilago maydis a2 mating-type locus genes lga2 and rga2 compromise pathogenicity in the absence of the mitochondrial p32 family protein Mrb1

Affiliations

The Ustilago maydis a2 mating-type locus genes lga2 and rga2 compromise pathogenicity in the absence of the mitochondrial p32 family protein Mrb1

Miriam Bortfeld et al. Plant Cell. 2004 Aug.

Abstract

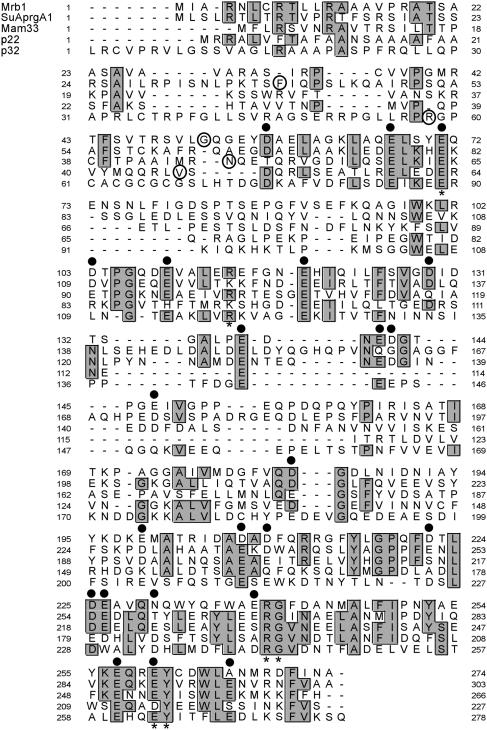
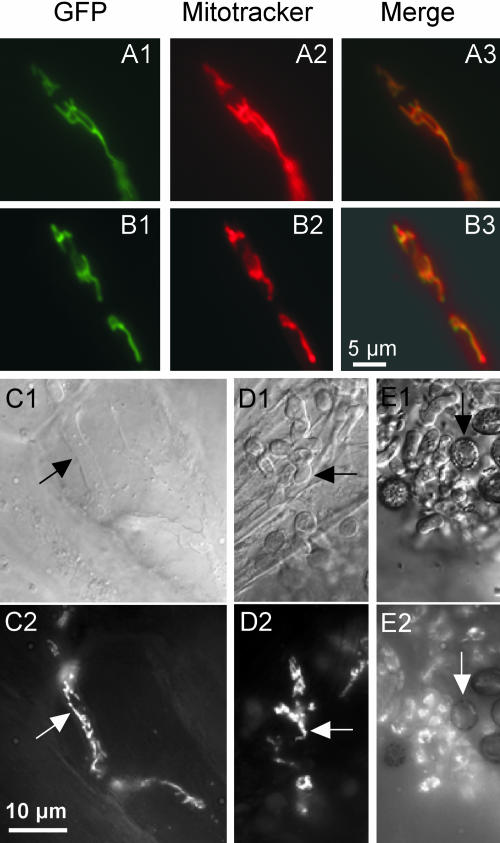
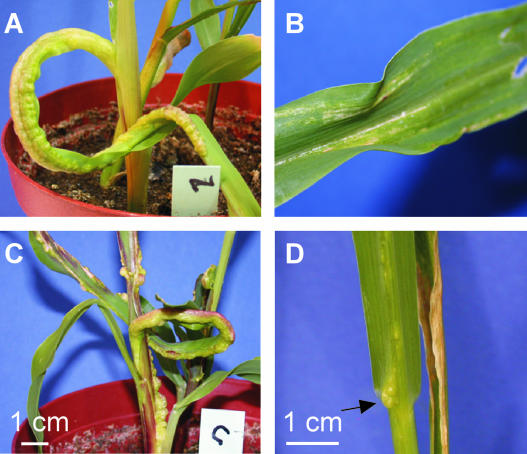
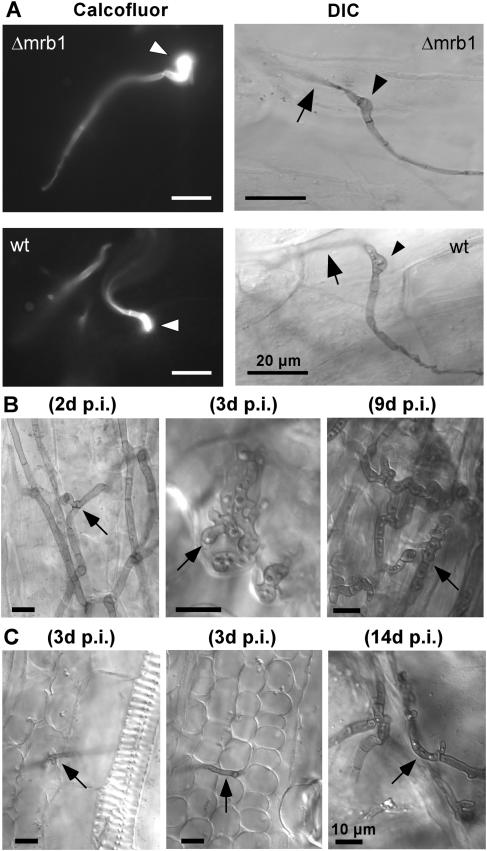
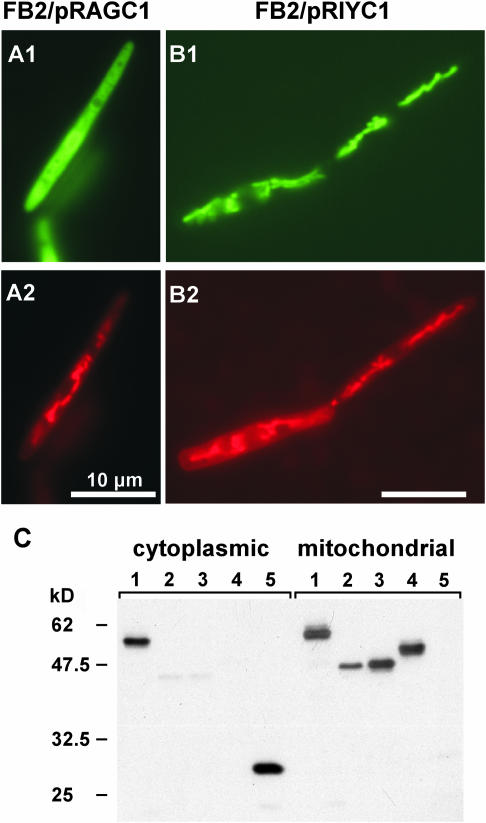
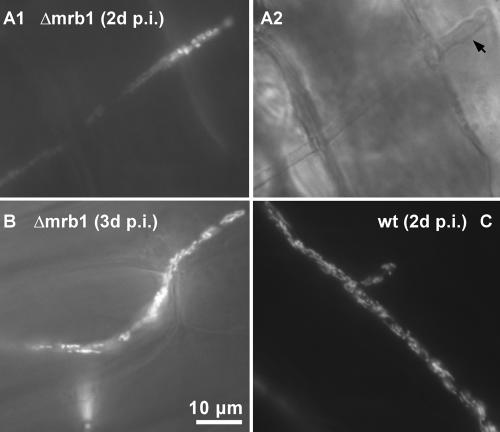
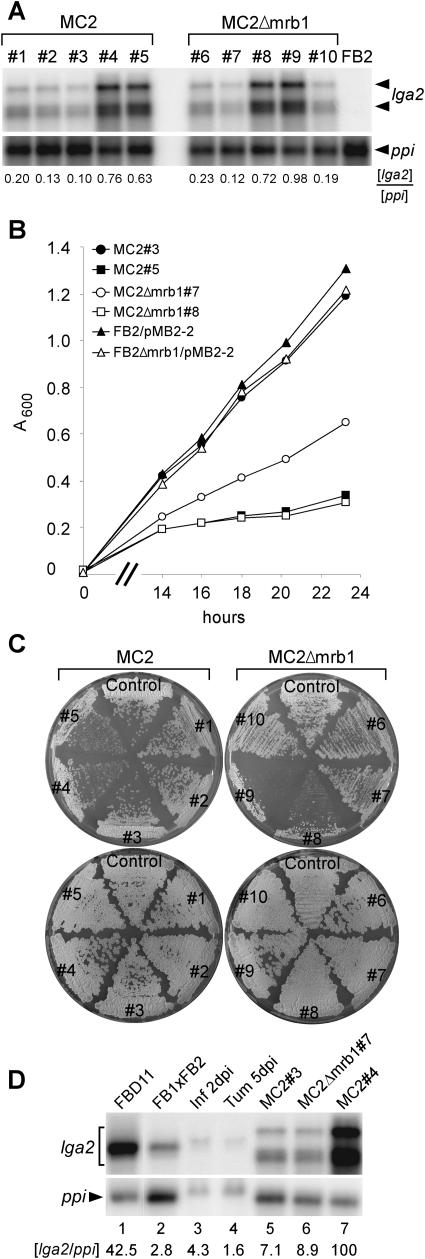
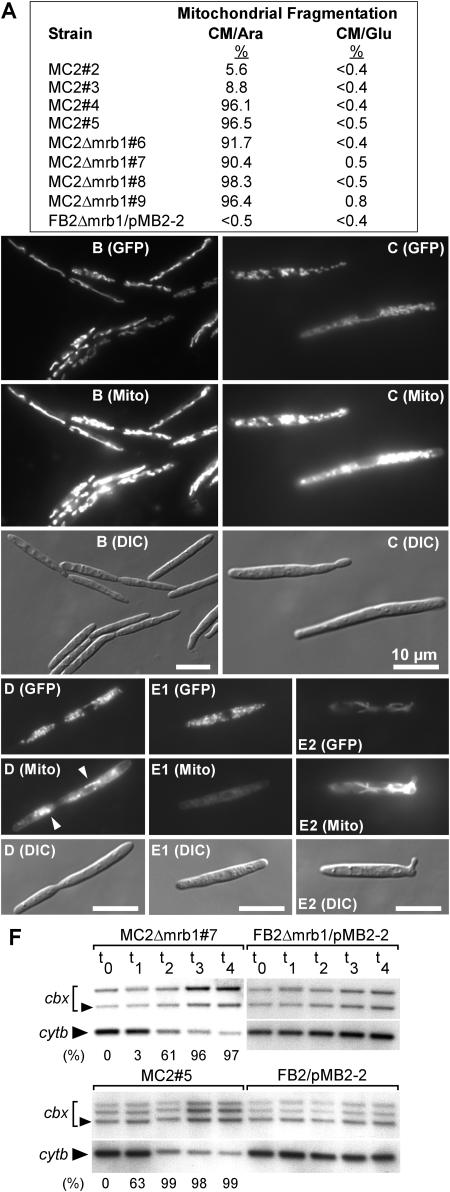
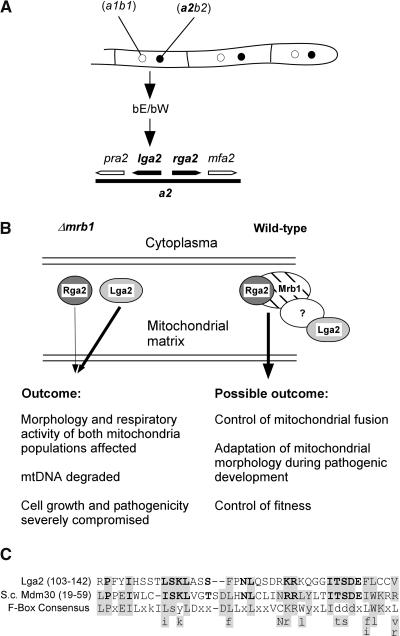
The Ustilago maydis mrb1 gene specifies a mitochondrial matrix protein with significant similarity to mitochondrial p32 family proteins known from human and many other eukaryotic species. Compatible mrb1 mutant strains were able to mate and form dikaryotic hyphae; however, proliferation within infected tissue and the ability to induce tumor development of infected maize (Zea mays) plants were drastically impaired. Surprisingly, manifestation of the mrb1 mutant phenotype selectively depended on the a2 mating type locus. The a2 locus contains, in addition to pheromone signaling components, the genes lga2 and rga2 of unknown function. Deletion of lga2 in an a2Deltamrb1 strain fully restored pathogenicity, whereas pathogenicity was partially regained in an a2Deltamrb1Deltarga2 strain, implicating a concerted action between Lga2 and Rga2 in compromising pathogenicity in Deltamrb1 strains. Lga2 and Rga2 localized to mitochondria and Mrb1 interacted with Rga2 in the yeast two-hybrid system. Conditional expression of lga2 in haploid cells reduced vegetative growth, conferred mitochondrial fragmentation and mitochondrial DNA degradation, and interfered with respiratory activity. The consequences of lga2 overexpression depended on the expression strength and were greatly exacerbated in Deltamrb1 mutants. We propose that Lga2 interferes with mitochondrial fusion and that Mrb1 controls this activity, emphasizing a critical link between mitochondrial morphology and pathogenicity.


Figures

Figure 1.
Figure 1.
Multiple Alignment of Mrb1 with Related Sequences from A. nidulans (SuAprgA1), S. cerevisiae (Mam33p), T. brucei (p22), and Human (p32). Identical (≥60%) positions are boxed and shaded. Predicted N-terminal amino acids generated after cleaving the presequence are encircled. Conserved acidic positions in the Mrb1 sequence are marked by dots. Asterisks mark highly conserved amino acids of p32 proteins (Glu89, Arg118, Arg242, Gly243, Glu263, and Tyr264) assigned to the protein surface in p32 (Jiang et al., 1999).
Figure 2.
Figure 2.
Localization and Expression of Mrb1. (A) and (B) U. maydis strains FB1mrb1:eGFP (A) and FB1/pMB2-1 (B) were grown in yeast extract peptone sucrose medium and assayed for fluorescence of GFP (left) and the mitochondrial marker dye CM-H2Xros (middle). The yellow color (right) indicates coincidence. The bar refers to all panels. (C) to (E) Spatial mrb1 expression during the life cycle of U. maydis. Plants were inoculated with mixtures of compatible wild-type reporter strains FB1mrb1:eGFP (a1b1) and FB2mrb1:eGFP (a2b2), which express mrb1 under its own promoter. Maize tissue samples were assayed by differential interference contrast (DIC) ([C1] to [E1]) and fluorescence microscopy ([C2] to [E2]). GFP fluorescence in intracellularly growing hyphae 5 DAI (C) and in sporogenic hyphae 10 and 12 DAI (arrow in [D] and [E]), respectively, are shown. The arrow in (E) points to a mature teliospore. The bar refers to all panels.
Figure 3.
Figure 3.
Complementation of Δmrb1 Strains with pMGH1. (A) to (C) Infection symptoms of maize plants 6 DAI with mixtures of wild-type FB1 (a1b1)/FB2 (a2b2) strains (A), FB1Δmrb1/FB2Δmrb1 strains (B), and FB1Δmrb1/pMGH1/FB2Δmrb1/pMGH1 strains (C). (D) Leaf tumor (arrow) 11 DAI with strains FB1Δmrb1/FB2Δmrb1.
Figure 4.
Figure 4.
Development of Δmrb1 Strains. (A) Appressoria development of hyphae emerging from a cross of compatible wild-type and Δmrb1 strains 26 h after inoculation. Left panels, Calcofluor staining of appressoria (arrowheads) from a cross of FB1/FB2 (wt) or FB1Δmrb1/FB2Δmrb1 (Δmrb1) strains on the leaf surface before penetration. Right panels, appressoria (arrowheads) on the leaf surface from combinations of FB1/pMB2-2/FB2/pMB2-2 strains (wt) and mutant FB1Δmrb1/pMB2-2/FB2Δmrb1/pMB2-2 strains (Δmrb1), from which filaments penetrate into leaf tissue (arrows). Filaments and appressoria were stained with Chlorazol Black E (CBE). Samples were assayed by DIC light microscopy. Bars in all panels = 20 μm. (B) and (C) Biotrophic growth of wild-type and Δmrb1 hyphae. Maize seedlings were inoculated with either mixtures of FB1/FB2 (B) or FB1Δmrb1/FB2Δmrb1 (C) strains. Tissue samples were collected as indicated. In all tissue samples, fungal hyphae (arrows) were stained with CBE and assayed by DIC light microscopy. Bars in all panels = 10 μm. The arrows point to branched hyphae growing through epidermal cells (left panel in [B]), lobed hyphal branches growing beneath the epidermal layer (middle panel in [B]), and a fragmenting sporogeneous hyphae (right panel in [B]). The arrows point to a short hyphal branch in epidermal cells (left panel in [C]) and a hyphae growing in the mesophyll layer (middle panel in [C]). Hyphal structures in a small leaf tumor that resulted from infection of a mixture of FB1Δmrb1/FB2Δmrb1 strains are shown (right panel in [C]). d p.i., days after inoculation.
Figure 5.
Figure 5.
Subcellular Localization of Rga2 and Immunodetection of Mrb1, Lga2, and Rga2 in Mitochondrial Fractions. (A) and (B) Localization of Rga2. U. maydis strains FB2/pRAGC1 (A) and FB2/pRIYC1 (B) were grown in liquid CM/Glu medium and assayed for GFP or YFP fluorescence ([A1] and [B1]) and distribution of the marker dye CM-H2Xros ([A2] and [B2]). Bars in all panels = 10 μm. (C) Proteins from U. maydis strains (1) FB2/pMGH1, (2) FB2/pRIYC1, (3) FB2Δmrb1/pRIYC1, (4) FB2/pLIGC1, and (5) CB35 were loaded. Strain CB35 expresses eGFP under the constitutive otef promoter (Basse et al., 2000). Cytoplasmic (each 50 μg) and mitochondrial protein fractions (each 5 μg) were loaded and immunostained using a monoclonal GFP IgG mouse antibody. The predicted sizes (kD) of fusion proteins are 52.0 (1), 45.8 (2,3), 46.6 (4), and 26.9 (5). Predicted mitochondrial target sequences were subtracted from the Mrb1 and Lga2 sequences for molecular weight calculation. Numbers at the left refer to positions of molecular mass standards in kD. The existence of a cytoplasmic portion of the Mrb1-eGFP fusion was verified in three independent experiments.
Figure 6.
Figure 6.
Mitochondrial Structures in Dikaryotic Hyphae during Pathogenic Growth. (A) to (C) Maize plants were inoculated with mixtures of FB1Δmrb1/pMB2-2 and FB2Δmrb1/pMB2-2 ([A] and [B]) or FB1/pMB2-2 and FB2/pMB2-2 (C). Tissue samples collected at the time points indicated from the 3rd maize leaf blade beneath the inoculation site were assayed by epifluorescence to detect mitochondrial-localized GFP ([A1], [B], and [C]). The bar refers to all panels. d p.i., days after inoculation. (A2) DIC microscopy from (A1). The arrow marks the hyphal tip.
Figure 7.
Figure 7.
Influence of lga2 Expression on Cellular Growth in the Presence or Absence of mrb1 and Comparison with lga2 Expression under Natural Conditions. (A) Expression analysis of MC2 (a2b2) and MC2Δmrb1 strains after shifting from CM/Glu to CM/Ara medium. An RNA gel blot of total RNA (7 μg per lane) was hybridized with a 32P-labeled lga2 fragment. Radioactive signals (both for lga2) were quantified and standardized by comparison with signals obtained from the ppi gene. (B) Growth comparison of MC2 and MC2Δmrb1 strains in liquid CM/Ara medium at 28°C. The time scale (x axis) refers to the time points after shifting from CM/Glu to CM/Ara medium. MC2#3, closed circle; MC2#5, closed square; MC2Δmrb1#7, open circle; MC2Δmrb1#8, open square; FB2/pMB2-2, closed triangle; FB2Δmrb1/pMB2-2, open triangle. Very similar results were obtained with strains MC2#2, 4 and MC2Δmrb1#6, 9 (data not shown). (C) Individual strains were streaked out from nourseothricin containing solid PD medium on solid CM/Ara (top) or CM/Glu (bottom) medium and incubated for 64 h at 28°C. Control (left), FB2/pMB2-2; control (right), FB2Δmrb1/pMB2-2. (D) Comparison of lga2 expression in MC2 and MC2Δmrb1 strains with expression during distinct stages of development. The strains and strain combinations indicated at the top (lanes 1 and 2) were grown on CM-charcoal plates for 48 h for RNA preparation. Lanes 3 and 4, RNA was isolated from infected (FB1xFB2) leaves and leaf tumors 2 and 5 DAI, respectively. Lanes 5 to 7, see (A); 7 μg (lanes 1 and 5 to 7), 15 μg (lane 2), and 80 μg (lanes 3 and 4) RNA were loaded. Two identical RNA gel blots were hybridized with 32P-labeled lga2 and ppi fragments, respectively. Radioactive signals were quantified and the ratios of lga2/ppi hybridization signals were calculated with the most intensive signal (lane 7) set to 100. For lanes 5 to 7, both lga2 signals were used for quantification. Different transcript sizes are probably because of variations in transcription start sites.
Figure 8.
Figure 8.
Overexpression of lga2 Influences Mitochondrial Morphology, Activity, and Integrity of mtDNA. (A) Mitochondrial fragmentation (%) in the indicated strains during logarithmic growth 17 to 19 h after transfer to liquid CM/Ara medium. Mitochondrial fragmentation was assessed from distribution of mitochondrial GFP fluorescence (see below). At least 200 cells were included for each calculation. (B) to (E) Strains MC2 (a2b2) and MC2Δmrb1 were assayed 20 h after transfer to liquid CM/Ara medium for GFP fluorescence (GFP) and distribution of the marker dye CM-H2Xros (Mito) by fluorescence and DIC light microscopy. Representative examples of mitochondrial patterns are shown. MC2#3 (B), MC2Δmrb1#7 (C), MC2#5 (D), and MC2Δmrb1#9 ([E1] and [E2]). Arrowheads in (D) point to spot-like fluorescence. The strong mitotracker fluorescence in thread-like mitochondria (E2) is compared with the hardly detectable fluorescence of fragmented mitochondria (E1) in the same strain. Exposure time for fluorescence photography: 600 ms ([B] and [C]); 2 s ([D] and [E]). All pictures ([B] to [E]) were prepared using Adobe Photoshop, applying identical processing functions and only those that could be applied equally to all pixels of the image being used. Bars in all panels = 10 μm. (F) Strains indicated on top were precultured in liquid CM/Glu medium, transferred to liquid CM/Ara, and incubated for additional 4 (t1), 8 (t2), 12 (t3), and 14 h (t4). Samples were removed at these time points for analysis of mtDNA degradation. An additional sample was collected from cells immediately before transfer in CM/Ara (t0). Total DNA was digested with BamHI/StuI and simultaneously hybridized with digoxigenin-labeled cytb and cbx (isolated from pSL-Cbx) fragments. The lower band represents the 1823-bp StuI/BamHI fragment from mitochondrial cytb. The 4330-bp band (arrowhead) represents the genomic StuI/BamHI cbx fragment. Additional bands stem from plasmid pMB2-2 (cbx) integrated in one or two copies. The percentage of fragmented mitochondria (determined from at least 100 cells) at the various time points is indicated at the bottom.
Figure 9.
Figure 9.
Model for the Interplay among Mrb1, Rga2, and Lga2. (A) Arrangement of the lga2 and rga2 genes on the a2 mating-type locus and direct control of lga2 expression by an active bE/bW complex formed in the dikaryon. (B) In Δmrb1 mutants, Lga2 and Rga2 interfere with mitochondrial fusion in an uncontrolled manner and thus affect cellular fitness and fungal virulence. The extent of negative contribution relies on the observed genetic relationship and is reflected by the different thickness of the arrows. Although the presence of Lga2 alone is already sufficient to compromise pathogenicity, Rga2 can only enhance this effect in an Lga2-dependent manner. In wild-type cells, Mrb1 directly controls Rga2, whereas Lga2 is indirectly controlled, possibly by complex formation with a yet unidentified protein. The complex is presumed to control mitochondrial fusion and to be needed for adaptation of mitochondrial morphology and function in response to special demands during the host interaction. It may thus provide for control of fungal fitness in planta. (C) The putative F-Box motif of Lga2 is aligned with the respective sequence of Mdm30 (S. cerevisiae) and an F-box consensus sequence (Patton et al., 1998). Residues that match F-box sequences are shaded. Identical or highly similar amino acids between Lga2 and Mdm30 are in boldface. Gaps have been introduced at a variable position of the F-box consensus sequence to increase the alignment. Small letters refer to amino acids that are not predominant in a position. Letters beneath the consensus refer to amino acids that fit the Lga2 or Mdm30 motifs and are found in at least two other F-boxes (Bai et al., 1996; Patton et al., 1998).

References

    1. Altschul, S.F., Madden, T.L., Schäffer, A.A., Zhang, J., Zhang, Z., Miller, W., and Lipman, D.J. (1997). Gapped BLAST and PSI-BLAST: A new generation of protein database search programs. Nucleic Acids Res. 25, 3389–3402. - PMC - PubMed
    1. Bai, C., Sen, P., Hofmann, K., Ma, L., Goebl, M., Harper, J.W., and Elledge, S.J. (1996). SKP1 connects cell cycle regulators to the ubiquitin proteolysis machinery through a novel motif, the F-box. Cell 86, 263–274. - PubMed
    1. Banuett, F., and Herskowitz, I. (1996). Discrete developmental stages during teliospore formation in the corn smut fungus, Ustlago maydis. Development 122, 2965–2976. - PubMed
    1. Basse, C.W., Kolb, S., and Kahmann, R. (2002). A maize-specifically expressed gene cluster in Ustilago maydis. Mol. Microbiol. 43, 75–93. - PubMed
    1. Basse, C.W., and Steinberg, G. (2004). Ustilago maydis, model system for analysis of the molecular basis of fungal pathogenicity. Mol. Plant. Pathol. 5, 83–92. - PubMed

MeSH terms

Associated data

LinkOut - more resources