

doi: 10.1016/j.str.2004.03.019.
E. coli trp repressor forms a domain-swapped array in aqueous alcohol
Affiliations
- PMID: 15274929
- PMCID: PMC3228604
- DOI: 10.1016/j.str.2004.03.019
Item in Clipboard
E. coli trp repressor forms a domain-swapped array in aqueous alcohol
Structure.
2004 Jun.
Abstract
The E. coli trp repressor (trpR) homodimer recognizes its palindromic DNA binding site through a pair of flexible helix-turn-helix (HTH) motifs displayed on an intertwined helical core. Flexible N-terminal arms mediate association between dimers bound to tandem DNA sites. The 2.5 A X-ray structure of trpR crystallized in 30% (v/v) isopropanol reveals a substantial conformational rearrangement of HTH motifs and N-terminal arms, with the protein appearing in the unusual form of an ordered 3D domain-swapped supramolecular array. Small angle X-ray scattering measurements show that the self-association properties of trpR in solution are fundamentally altered by isopropanol.
Figures
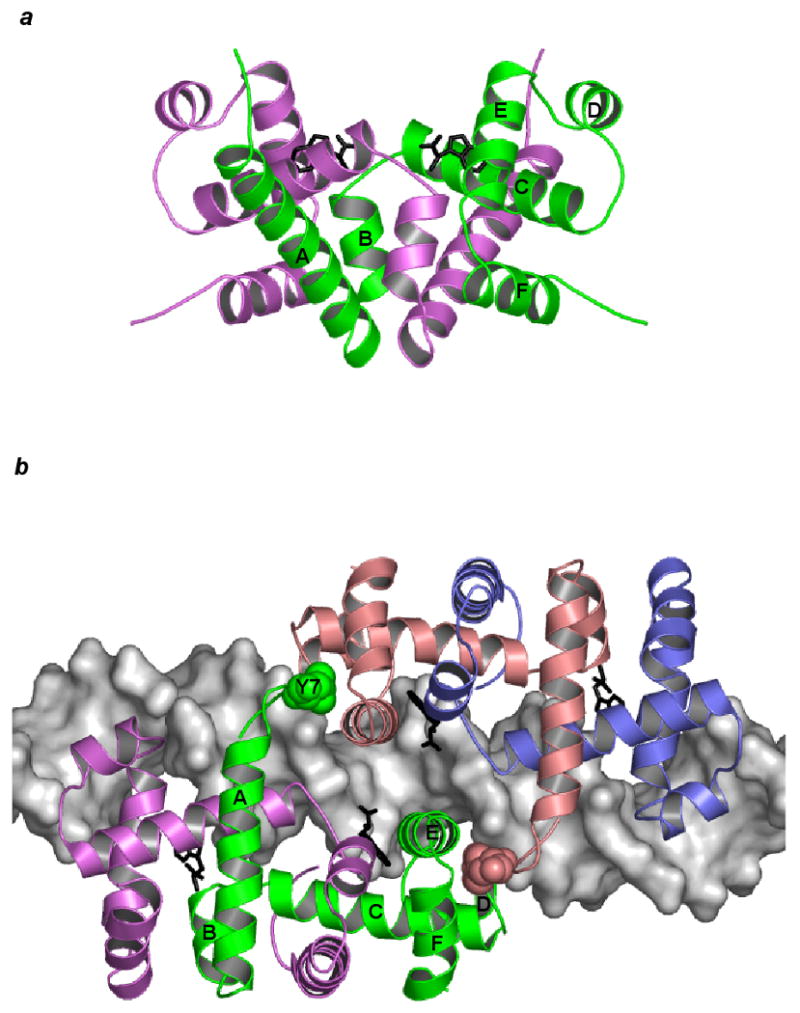
Dimeric trpR. (a) The trpR dimer is shown in schematic ribbon view. Two equivalent subunits are represented in green and purple (orthorhombic crystal form, PDB entry 2WRP (Lawson et al., 1988)). Two L-tryptophan corepressors (black) fill hydrophobic pockets within the extensive interface between the intertwined subunits. (b) Two trpR dimers are shown bound to DNA at tandem sites spaced 8 base-pairs apart (left dimer: green and purple subunits, right dimer: pink and blue subunits, tandem trpR-DNA complex, PDB entry 1TRR (Lawson and Carey, 1993)). For the subunits participating in tandem association between the two dimers (left dimer: green, right dimer: pink), flexible N-terminal arm residue Tyr 7 is displayed in space-fill and labeled on the green subunit. In both (a) and (b), helices A-F of the green subunit are labelled.
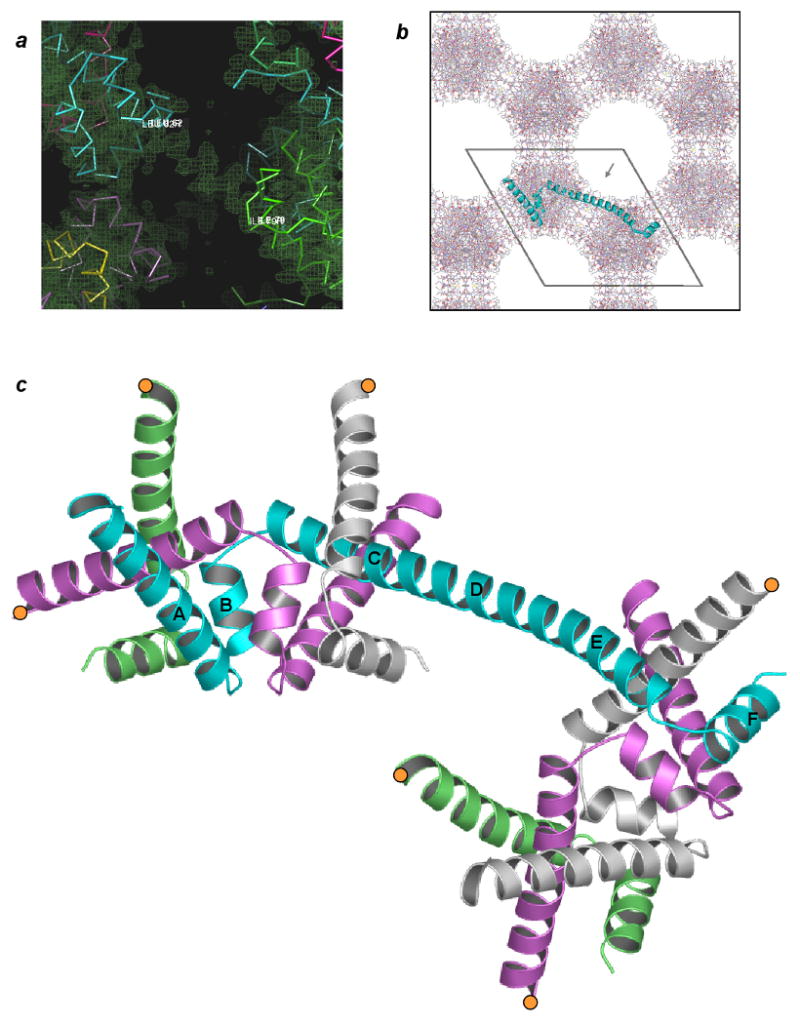
Domain-swapped trpR. (a) Electron density derived from initial molecular replacement phases. “Solvent-flipped” map (Abrahams and Leslie, 1996) is shown overlaid on C∀ traces of several crystal-symmetry equivalent subunits of the dimer molecular replacement search model (varied colors). Residues Leu62 (cyan subunit) and Ile79 (green subunit) define the boundaries of a helical span of density between crystallographically related copies of the search model. Search model D-helices sit outside of electron density. (b) The ds-trpR array hexagonal crystal lattice, ab plane view. All protein atoms within one unit cell c repeat are shown. The polypeptide backbone path of a single trpR subunit, representing one asymmetric unit of the P6122 symmetry structure, is represented with a cyan ribbon. Pores within the lattice are ∼50 Å in diameter (grey arrow in pore indicates view orientation of panel (a)). (c) Domain-swapped trpR, schematic ribbon view. The central cyan subunit, shown in same orientation as cyan subunit in (b), bridges two “nodes” of the array. Truncated segments of equivalent subunits that complete the two nodes are shown in alternating colors, with positions of truncation indicated by orange circles. The orientation of the upper, left node is equivalent to the orientation of the trpR dimer in Fig. 1a. Helices of the cyan subunit are labelled according to dimer convention. Helices C, D and E of the dimer coalesce to form a long, central helix in ds-trpR.
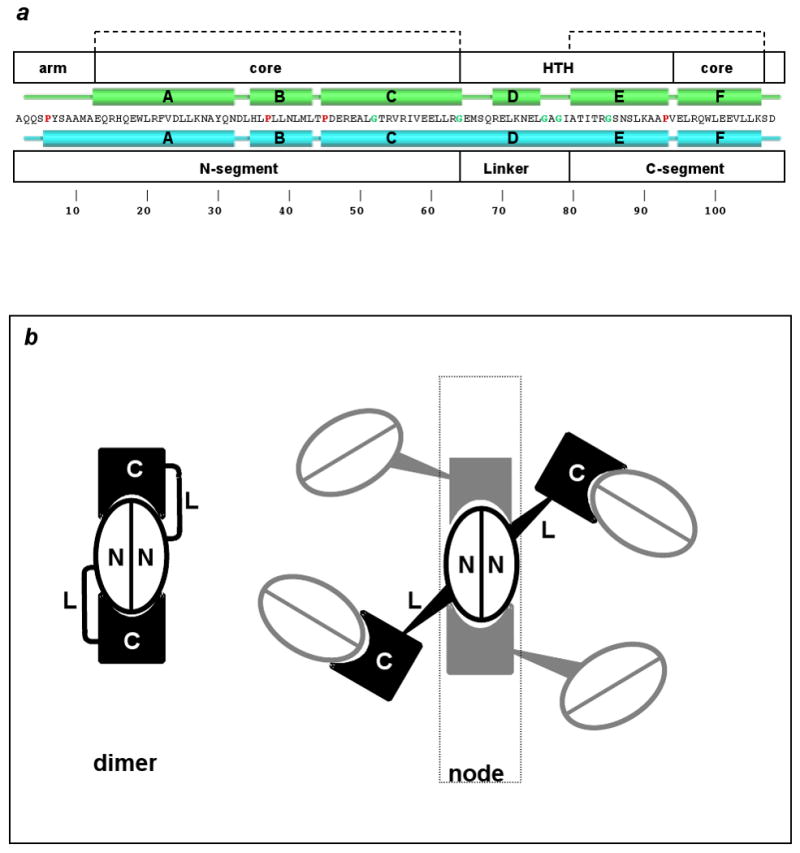
Dimeric vs. domain-swapped trpR. (a) TrpR primary structure (one-letter code) is shown at center with secondary structural elements above in green for the dimer, and below in cyan for ds-trpR. Proline and glycine residues are highlighted with red and green characters, respectively. White boxes above indicate structural elements of the dimer: N-terminal arm (arm), core, and helix-turn-helix (HTH); white boxes below define domain-swap elements: N- and C-segments, linker. Dashed brackets at top indicate residues with conserved fold in dimeric and domain-swapped trpR. (b) Schematic representation of domain-swapping by trpR. At left, the dimer fold is shown. Each subunit is represented as an N and C segment connected by flexible linker L. At right, an array node is generated when four neighbors swap C-terminal segments with a central dimer (we use the term “node” following its definition as a knot or connecting point). Tapered lines represent the approximate tetrahedral geometry of node coordination.
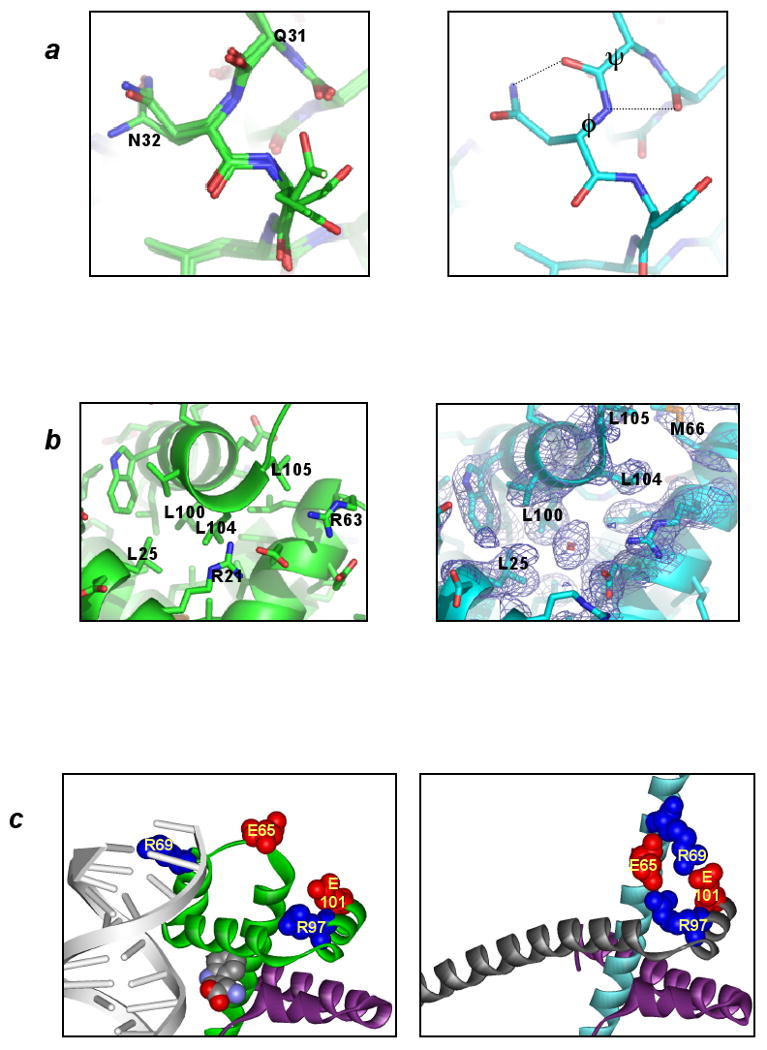
Dimeric vs. domain-swapped trpR: structural differences. In each panel the dimeric structure is represented at left and ds-trpR array is represented at right. (a) Conformational change at a solvent-exposed interhelical turn. In trpR dimer structures overlaid at left (1WRP (Schevitz et al., 1985), 2WRP (Lawson et al., 1988) and 3WRP (Zhang et al., 1987)), main-chain torsion angles of residues in the turn between helices A and B are consistently in most-favored regions of the Ramachandran plot; in ds-trpR, Gln31 P and Asn32 N angles (labeled at right) are rotated by +60E and -60E respectively, moving these residues to less-favored (though allowed) regions. Dotted lines indicate new hydrogen bonds that may form as a consequence of the conformational change. (b) Solvent intrusion at the C-terminus. In all known dimeric trpR structures, a bulge in the final turn of helix F permits the side-chain of Leu 104 to occupy a hydrophobic pocket within the subunit interface (left). In ds-trpR, the final turn adopts a regular helix structure, and the isopropyl side-chain of Leu 104 is displaced by solvent (right, red crosshatch, ds-trpR model shown with (2Fo-Fc), model phased map, contour level = 1 Φ). The solvent density is roughly spherical, but its position with respect to atom neighbors is more consistent with isopropanol than water. (c) Linker-core charge interactions in ds-trpR. Conversion of the first linker turn to helix in ds-trpR (compare green subunit at left with cyan subunit at right) brings Glu65 and Arg69 in close proximity both to each other and to complementary charged residues (Arg97, Glu101) in the swapped F helix. The left panel also highlights the role of the linker in DNA recognition by dimeric trpR (trp repressor/DNA complex 1TRO (Otwinowski et al., 1988)). Sidechains (labeled) and L-tryptophan (unlabeled) are shown in space-fill.
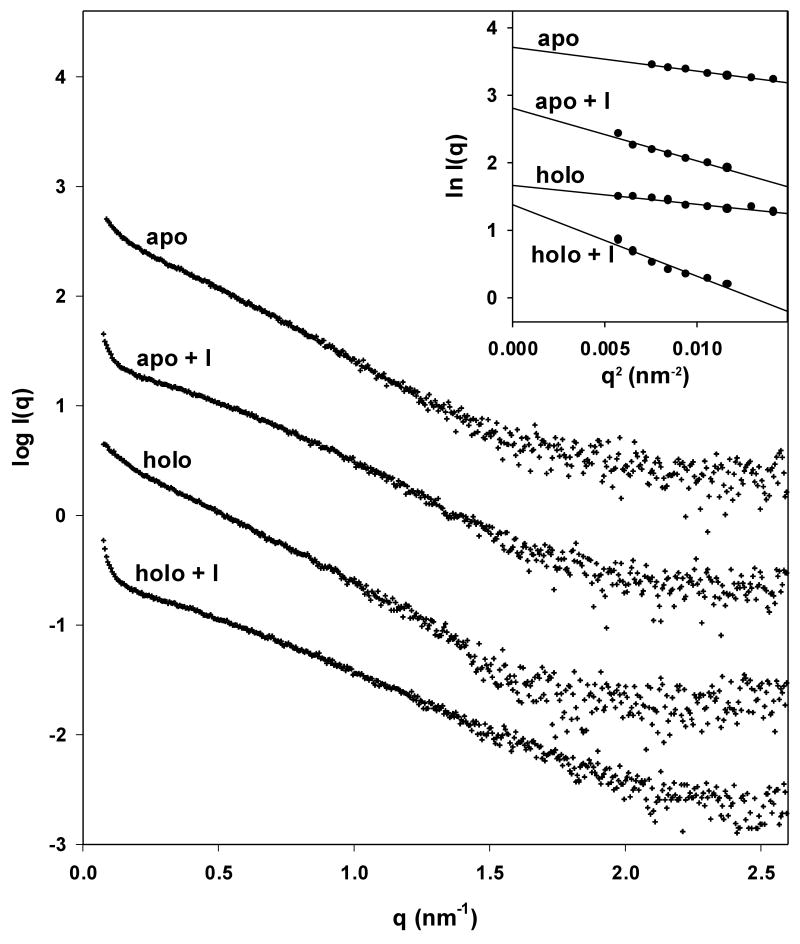
Small angle X-ray scattering of trpR: intensity vs. resolution profiles. (a) Representative scattering of trpR in solution, ± 2 mM L-tryptophan and ± 16% (v/v) isopropanol. Scattering intensities are plotted as log I(q) vs. q (q=4π sin θ/λ; θ is 1/2 of the scattering angle; λ is the wavelength of the incident radiation). Profiles shown correspond to measurements at 28 mg/ml protein; similar profiles were obtained at 7, 14, and 19 mg/ml. Inset: Guinier plot (ln I(q) vs. q2) of the lowest resolution region, where scattering is dominated by the largest particles in solution. The linear fit was used to estimate the radius of gyration, Rg, and forward scatter, I(0), from the slope and intercept, respectively (see Methods). Y-axis values are offset in both plots for ease of comparison. (b) Distribution of Guinier-derived Rg. (c) Distribution of Guinier-derived forward scatter normalized to protein concentration. In both (b) and (c), vertical bars and brackets indicate the average and standard deviation of four measurements (one each at 7, 14, 19, and 28 mg/ml trpR) for each solution condition. Key: “apo” = trp aporepressor; “holo” = trp aporepressor + 2 mM L-tryptophan; the “+I” extension indicates inclusion of 16% (v/v) isopropanol (see Methods for further experimental details).
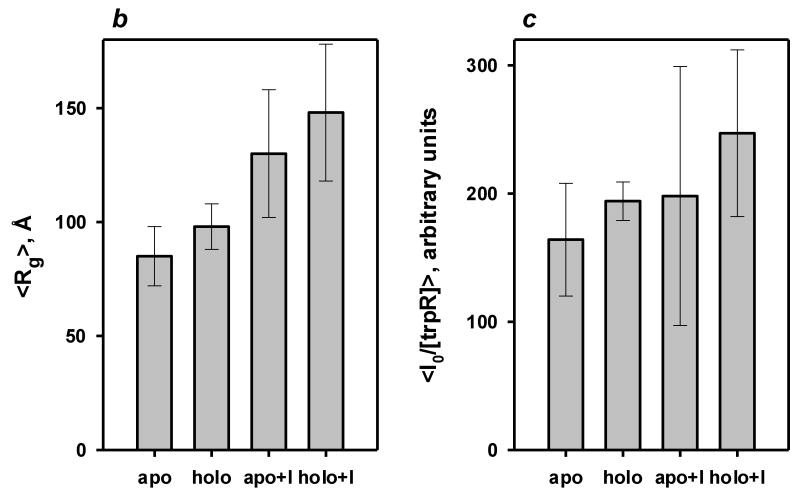
Small angle X-ray scattering of trpR: intensity vs. resolution profiles. (a) Representative scattering of trpR in solution, ± 2 mM L-tryptophan and ± 16% (v/v) isopropanol. Scattering intensities are plotted as log I(q) vs. q (q=4π sin θ/λ; θ is 1/2 of the scattering angle; λ is the wavelength of the incident radiation). Profiles shown correspond to measurements at 28 mg/ml protein; similar profiles were obtained at 7, 14, and 19 mg/ml. Inset: Guinier plot (ln I(q) vs. q2) of the lowest resolution region, where scattering is dominated by the largest particles in solution. The linear fit was used to estimate the radius of gyration, Rg, and forward scatter, I(0), from the slope and intercept, respectively (see Methods). Y-axis values are offset in both plots for ease of comparison. (b) Distribution of Guinier-derived Rg. (c) Distribution of Guinier-derived forward scatter normalized to protein concentration. In both (b) and (c), vertical bars and brackets indicate the average and standard deviation of four measurements (one each at 7, 14, 19, and 28 mg/ml trpR) for each solution condition. Key: “apo” = trp aporepressor; “holo” = trp aporepressor + 2 mM L-tryptophan; the “+I” extension indicates inclusion of 16% (v/v) isopropanol (see Methods for further experimental details).
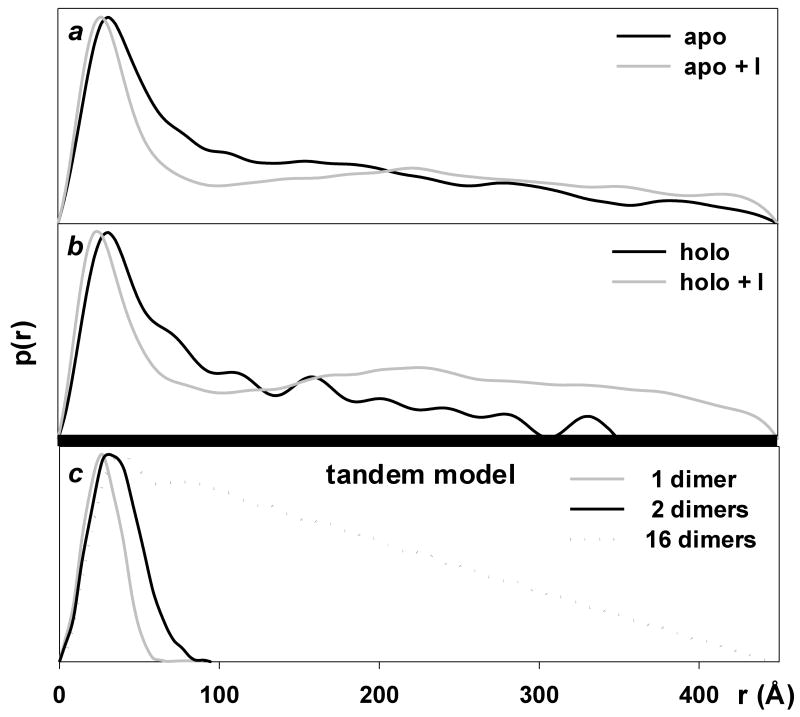
Small angle X-ray scattering of trpR: pair-distance distribution functions (p(r)). P(r) is obtained by Fourier transformation directly from scattering curves and it describes the distribution of distances r between pairs of scattering centers within particles present in solution. The function provides a measure of particle dimensions and shape. (a) and (b): P(r) of experimental scattering profiles presented in Fig. 5. (c): P(r) calculated for models derived from crystal structures. DNA was excluded from all calculations. The “1-dimer” and “2-dimer” models (Rg = 21 Å and 32 Å, respectively) are as illustrated in Fig. 1 panels a and b. The “16-dimer” model corresponds to 4-turns of the left-handed (43) superhelix that forms around DNA in tandem trpR/DNA crystals (Rg = 125 Å, length ≈ 440 Å, model not shown) (Lawson and Carey, 1993). A similar superhelix is formed by trpR dimers without DNA (A. Chin, B.B., and C.L.L., manuscript in preparation). The p(r) curve for the 16-dimer model (dotted line) shows the characteristic sharp rise followed by linearly decreasing slope that is typical for rod-shaped particles (Glatter and Kratky, 1982). For ease of comparison, p(r) curves are shown with their peak values set to a common, arbitrary y value.
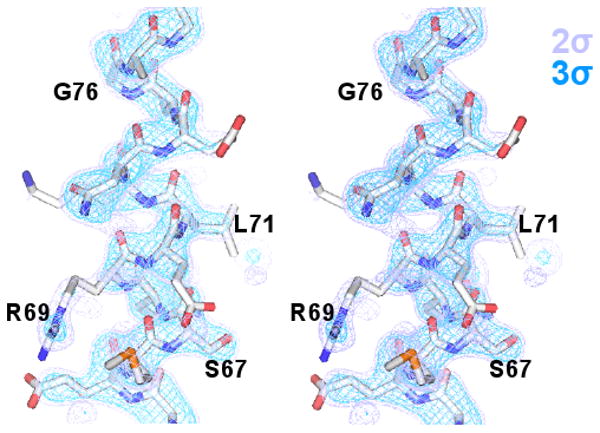
Final “omit” map of the ds-trpR linker (stereo view). A sigmaa-weighted (Fo-Fc) difference map (purple, 2Φ; blue, 3Φ) is shown overlaid on the region of the ds-trpR model excluded from calculation of map phases (residues 68-74).
References
-
- Abrahams JP, Leslie AGW. Methods used in the structure determination of bovine mitochondrial F-1 ATPase. 5. 1996;2:30–42. - PubMed
-
- Babu KR, Moradian A, Douglas DJ. The methanol-induced conformational transitions of beta-lactoglobulin, cytochrome c, and ubiquitin at low pH: a study by electrospray ionization mass spectrometry. J Am Soc Mass Spectrom. 2001;12:317–328. - PubMed
-
- Buck M. Trifluoroethanol and colleagues: cosolvents come of age. Recent studies with peptides and proteins. Q Rev Biophys. 1998;31:297–355. - PubMed
Publication types
MeSH terms
Substances
Associated data
- Actions
Grants and funding
LinkOut - more resources
Full Text Sources
