. 2004 Aug;165(2):425-37.
doi: 10.1016/S0002-9440(10)63308-1.

Antigen transport and cytoskeletal characteristics of a distinct enterocyte population in inflammatory bowel diseases

Affiliations

Antigen transport and cytoskeletal characteristics of a distinct enterocyte population in inflammatory bowel diseases

Sabine Kersting et al. Am J Pathol. 2004 Aug.

Abstract

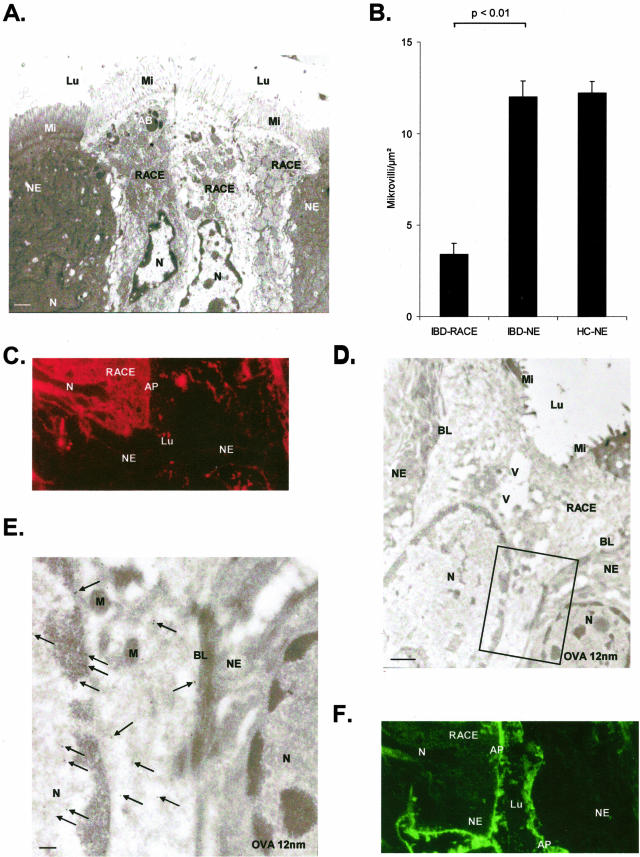
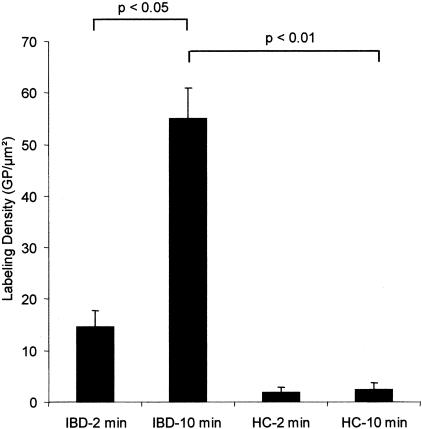
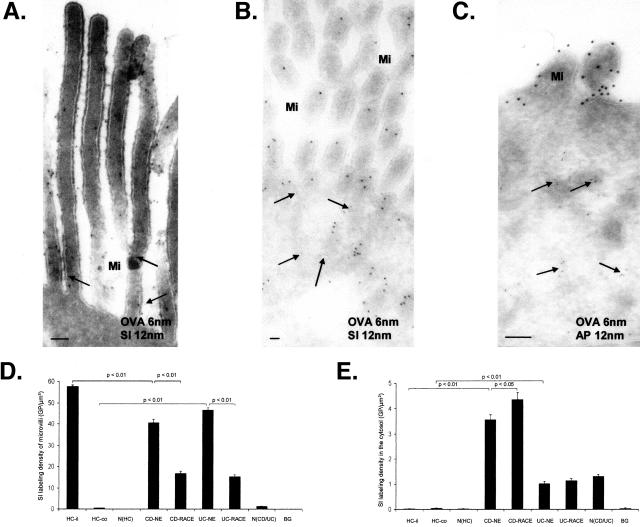
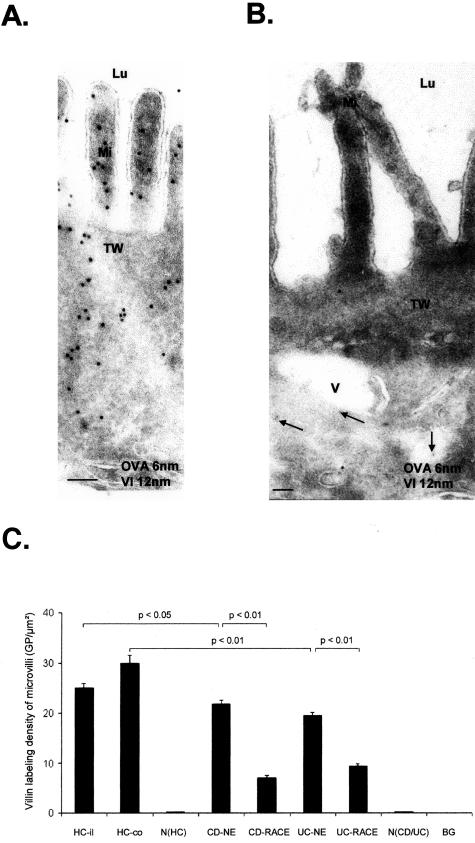
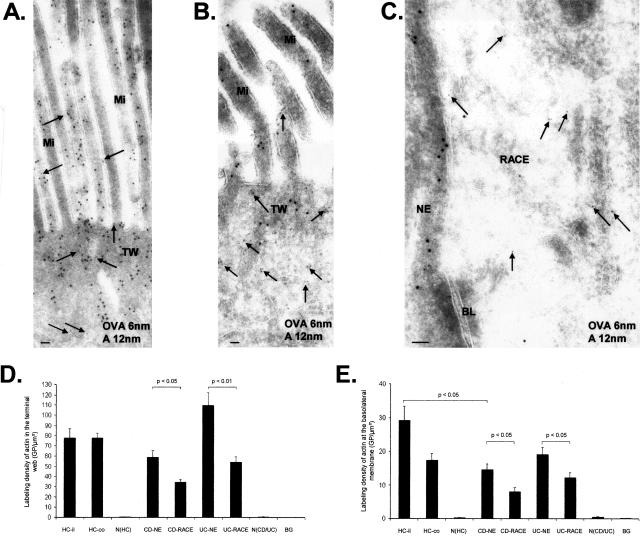
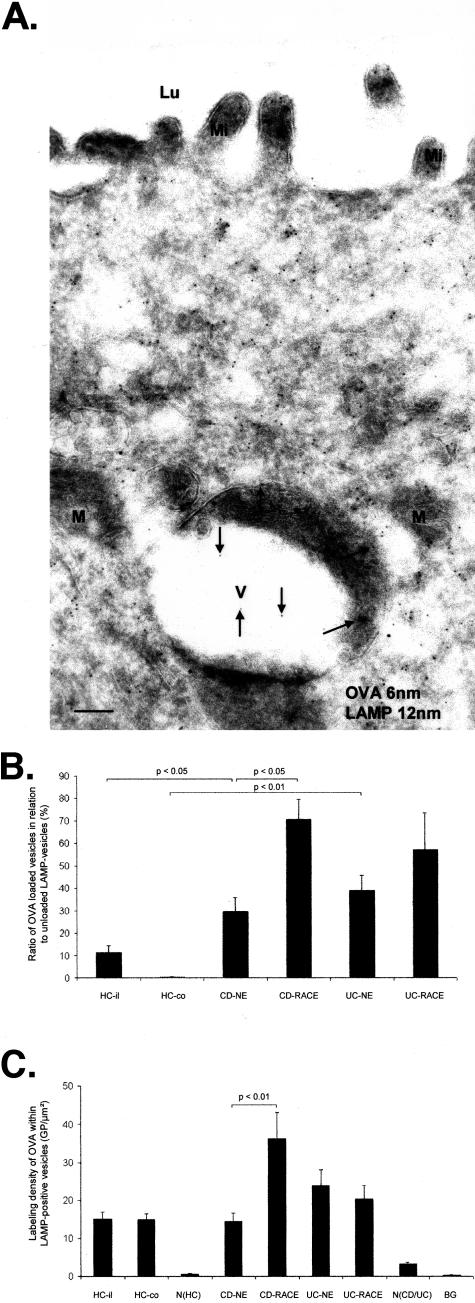
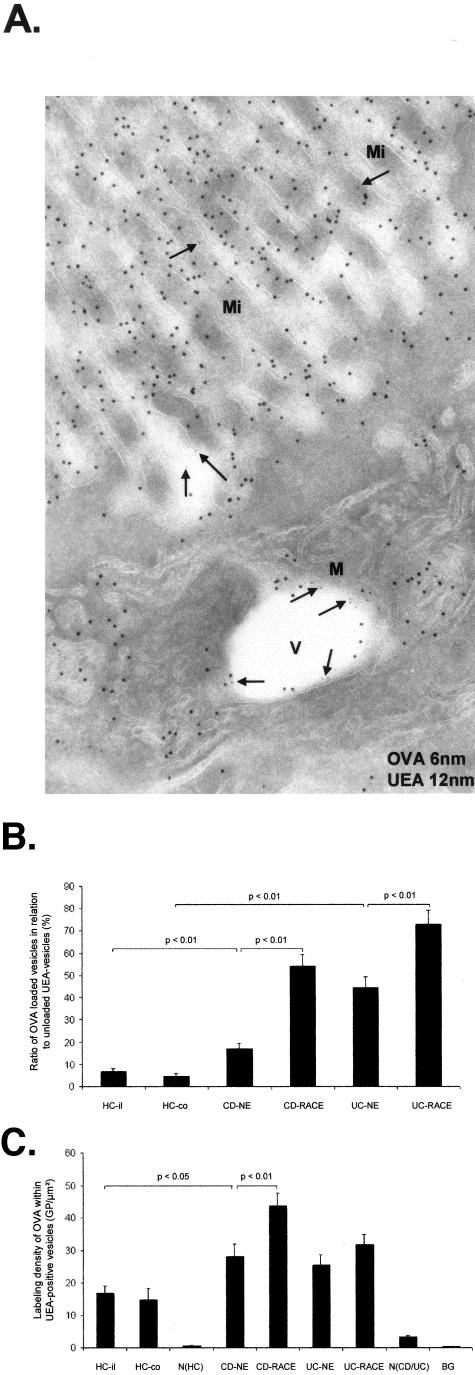
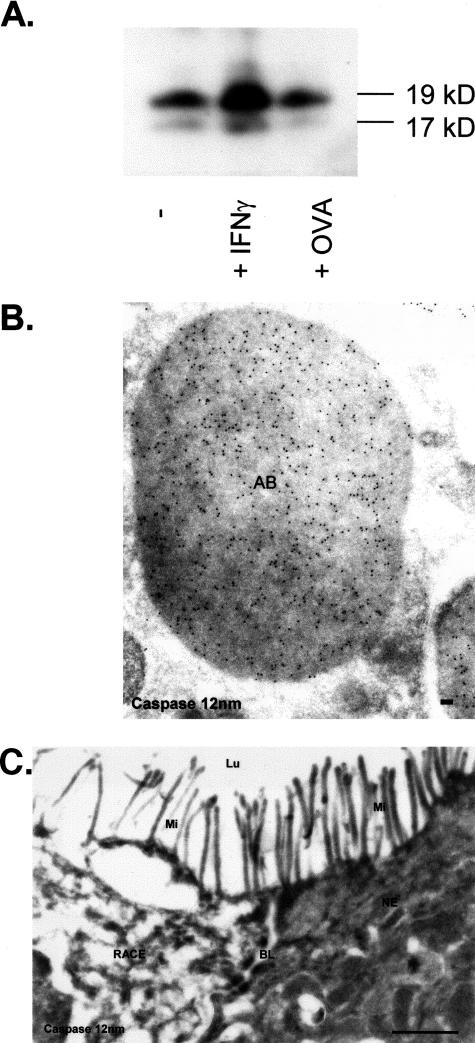
Intestinal antigen uptake is enhanced in inflammatory bowel disease. We analyzed transcellular transport routes of antigens in different compartments of normal enterocytes and atypical intestinal epithelial cells called "rapid antigen uptake into the cytosol enterocytes" (RACE cells). These cells constitute a recently described population of enterocyte-derived cells, which are increased in inflammatory bowel disease. Mucosa of freshly resected specimens were incubated with the antigens ovalbumin or horseradish peroxidase. Ultrastructural labeling patterns of differentiation-dependent proteins, the brush-border enzyme sucrase-isomaltase and the cytoskeleton proteins villin and actin, were determined in enterocytes. Apoptosis was investigated biochemically and ultrastructurally by cleavage of caspase-3. Both antigens were transported to late endosomes and to trans-Golgi vesicles of enterocytes in inflammatory bowel disease and control specimens. Quantitative evaluation revealed a significantly increased transepithelial antigen transport in both compartments of RACE relative to normal enterocytes. Labeling densities for sucrase-isomaltase, villin, and actin were decreased in RACE relative to normal enterocytes. Caspase-3 was not increased in RACE cells relative to controls. RACE cells are characterized by increased antigen transport to late endosomes and the trans-Golgi network, a disassembled cytoskeleton and lower concentrations of proteins that are markers of cell differentiation.


Figures

Figure 1
Figure 1
CD (ileum OVA incubation 10 minutes). A: Electron microscopy: three RACE cells surrounded by NE cells. Epon section. B: Quantitation of microvilli in RACE and NE cells. C: Immunofluorescence: rhodamine-labeled OVA in the cytosol of RACE cells. D: Immunoelectron microscopic localization of OVA (12-nm large gold particles) within the epithelial layer. A RACE cell is situated between NE cells. E: Higher magnification of the box in D: RACE cell with moderate OVA labeling (arrows) in the cytosol and in the nucleus. NE cell without any OVA labeling in the nucleus and the cytosol. F:Fluorescein isothiocyanate-labeled SI on microvilli of NE cells and RACE cells. Labeling for SI is present in the cytosol of all RACE cells and some NE cells. AB, Apoptotic body; AP, apical membrane; Lu, lumen; Mi, microvilli; V, vesicle; BL, basolateral membrane; SI, sucrase-isomaltase; N, nucleus; M, mitochondriae. Scale bars: 1 μm (A, D); 0.1 μm (F).
Figure 2
Figure 2
Quantitation of OVA at the paracellular space in IBD and controls. Graphs show mean values, error bars represent SEM.
Figure 3
Figure 3
Immunoelectron microscopic co-localization of OVA (OVA incubation 10 minutes, 6-nm gold particles) and SI or aminopeptidase (12-nm gold particles). A: Healthy control (ileum). SI and OVA (arrows) labeling on microvilli. B: CD (ileum). RACE cell with OVA labeling in the cytosol (arrows) and SI labeling on microvilli and in the cytosol. C: CD (ileum). RACE cell with OVA in the cytosol (arrows) and aminopeptidase labeling restricted to microvilli. D: Microvillous labeling density of SI. E: Cytosolic labeling densities of SI. Graphs show mean values, error bars represent SEM. N(HC), Nucleus of healthy controls; N(CD/UC), nucleus of CD and UC; HC-il, healthy ileal controls; HC-co, healthy colon controls; BG, background; Mi, microvilli; SI, sucrase-isomaltase; AP, aminopeptidase. Scale bars, 0.1 μm.
Figure 4
Figure 4
Immunoelectron microscopic co-localization of OVA (OVA incubation 10 minutes; 6-nm gold particles) and villin (12-nm gold particles). A: Healthy control (ileum). Strong villin labeling on microvilli and in the terminal web. B: CD (ileum). RACE cell with OVA labeling (arrows) in the cytosol and weak villin labeling on microvilli and the terminal web. C: Microvillous labeling densities of villin. Graph shows mean values, error bars represent SEM. N(HC), Nucleus of healthy controls; N(CD/UC), nucleus of CD and UC; HC-il, healthy ileum controls; HC-co, healthy colon controls; BG, background; Lu, lumen; Mi, microvilli; V, vesicle; TW, terminal web. Scale bars, 0.1 μm.
Figure 5
Figure 5
Immunoelectron microscopic co-localization of OVA (OVA incubation 10 minutes; 6-nm gold particles, arrows) and actin (12-nm gold particles). A: Healthy control (ileum). High labeling density for actin on microvilli and terminal web. B: CD (ileum). RACE cell with OVA labeling in the cytosol (arrows) and low labeling density of actin on microvilli and terminal web. C: CD (ileum). Left: NE cell with high labeling density of actin near the basolateral membrane. Right: RACE cell with OVA labeling in the cytosol (arrows) and low labeling density of actin near the basolateral membrane. D: Labeling densities of actin in the terminal web. E: Labeling densities of actin near the basolateral membrane. Graphs show mean values, error bars represent SEM. N(HC), Nucleus of healthy controls; N(CD/UC), nucleus of CD and UC; HC-il, healthy ileum controls; HC-co, healthy colon controls; BG, background; Mi, microvilli; BL, basolateral membrane; TW, terminal web. Scale bars, 0.1 μm.
Figure 6
Figure 6
Immunoelectron microscopical co-localization of OVA (OVA incubation 10 minutes; 6-nm gold particles) and LAMP (12-nm gold particles). CD (ileum). A: RACE cell with OVA-loaded (arrows) LAMP-positive vesicle. B: Antigen transport in LAMP-positive vesicles. C: Labeling densities of OVA in antigen-loaded LAMP vesicles. Graphs show mean values, error bars represent SEM. N(HC), Nucleus of healthy controls; N(CD/UC), nucleus of CD and UC; HC-il, healthy ileum controls; HC-co, healthy colon controls; BG, background; Lu, lumen; Mi, microvilli; V, vesicle; M, mitochondrium. Scale bar, 0.1 μm.
Figure 7
Figure 7
Immunoelectron microscopic co-localization of OVA (OVA incubation 10 minutes; 6-nm gold particles) and UEA (12-nm gold particles). CD (ileum). A: NE cell with OVA (arrows)-loaded UEA-positive vesicle. B: Antigen transport in UEA-positive vesicles. C: Labeling densities of OVA in antigen-loaded UEA vesicles. Graphs show mean values, error bars represent SEM. N(HC), Nucleus of healthy controls; N(CD/UC), nucleus of CD and UC; HC-il, healthy ileum controls; HC-co, healthy colon controls; BG, background; Mi, microvilli; V, vesicle; M, mitochondrium. Scale bars, 0.1 μm.
Figure 8
Figure 8
Detection of caspase-3 by immunoelectron microscopy and Western blotting. A: Caspase-3 expression in HT29 monolayers. B: Subcellular detection of caspase-3 (12-nm gold particles) within apoptotic HT-29/B6 enterocytes. C: Absent caspase-3 labeling in the cytosol of RACE and NE. AB, Apoptotic body; BL, basolateral membrane; Lu, lumen; Mi, microvilli. Scale bars: 0.1 μm (B); 1 μm (C).

References

    1. Soderholm JD, Olaison G, Lindberg E, Hannestad U, Vindels A, Tysk C, Jarnerot G, Sjodahl R. Different intestinal permeability patterns in relatives and spouses of patients with Crohn’s disease: an inherited defect in mucosal defence? Gut. 1999;44:96–100. - PMC - PubMed
    1. Dvorak AM, Dickersin GR. Crohn’s disease: transmission electron microscopic studies. I. Barrier function. Possible changes related to alterations of cell coat, mucous coat, epithelial cells, and Paneth cells. Hum Pathol. 1980;11:561–571. - PubMed
    1. Schmitz H, Barmeyer C, Fromm M, Runkel N, Foss HD, Bentzel CJ, Riecken EO, Schulzke JD. Altered tight junction structure contributes to the impaired epithelial barrier function in ulcerative colitis. Gastroenterology. 1999;116:301–309. - PubMed
    1. Soderholm JD, Peterson KH, Olaison G, Franzen LE, Westrom B, Magnusson KE, Sjodahl R. Epithelial permeability to proteins in the noninflamed ileum of Crohn’s disease? Gastroenterology. 1999;117:65–72. - PubMed
    1. Schurmann G, Bruwer M, Klotz A, Schmid KW, Senninger N, Zimmer KP. Transepithelial transport processes at the intestinal mucosa in inflammatory bowel disease. Int J Colorectal Dis. 1999;14:41–46. - PubMed

Publication types

MeSH terms