. 2004 Aug 3;101(31):11438-43.
doi: 10.1073/pnas.0404396101. Epub 2004 Jul 26.

In vivo positron-emission tomography imaging of progression and transformation in a mouse model of mammary neoplasia

Affiliations

In vivo positron-emission tomography imaging of progression and transformation in a mouse model of mammary neoplasia

Craig K Abbey et al. Proc Natl Acad Sci U S A. .

Abstract

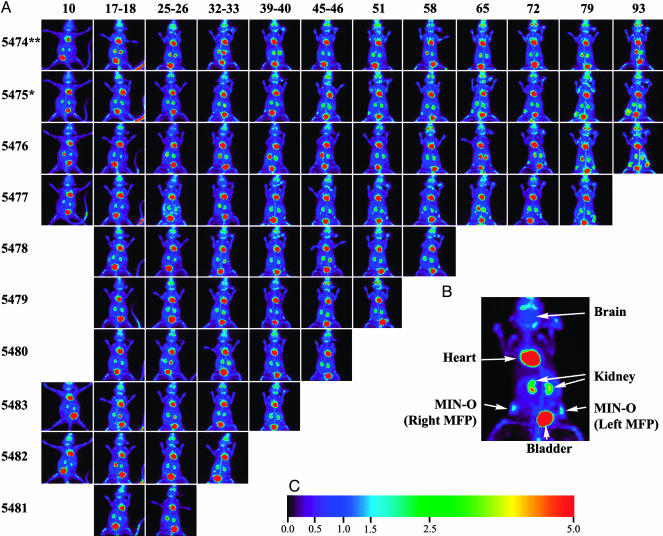
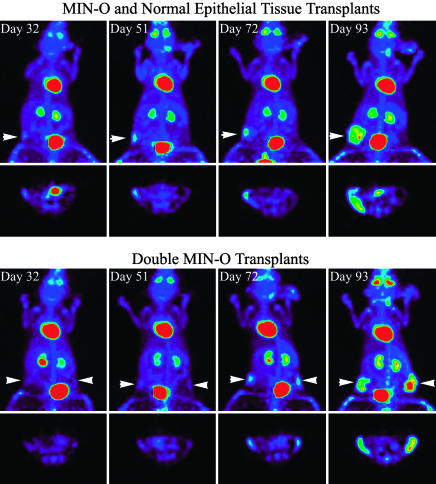
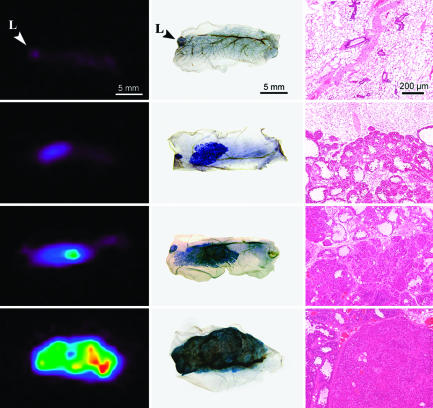
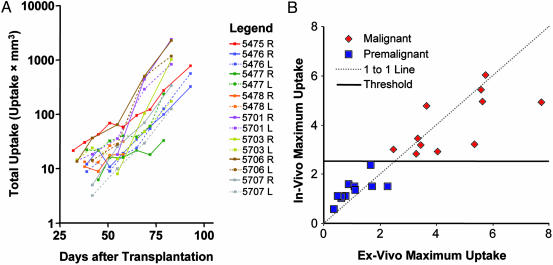
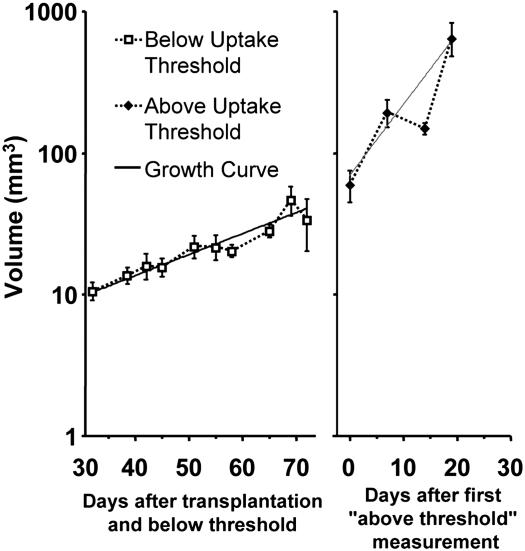
Imaging mouse models of human cancer promises more effective analysis of tumor progression and reduction of the number of animals needed for statistical power in preclinical therapeutic intervention trials. This study utilizes positron emission tomography imaging of 2-[18F]-fluoro-deoxy-D-glucose to monitor longitudinal development of mammary intraepithelial neoplasia outgrowths in immunocompetent FVB/NJ mice. The mammary intraepithelial neoplasia outgrowth tissues mimic the progression of breast cancer from premalignant ductal carcinoma in situ to invasive carcinoma. Progression of disease is clearly evident in the positron emission tomography images, and tracer uptake correlates with histological evaluation. Furthermore, quantitative markers of disease extracted from the images can be used to track proliferation and progression in vivo over multiple time points.


Figures

Fig. 1.
Fig. 1.
Longitudinal imaging with PET. (A) Layout of experimental data. Each row of images corresponds to a given animal followed in the study (identified by number at left), and each column corresponds to a time point for imaging. Animals were followed longitudinally from as early as 10 days to as late as 93 days posttransplantation of MIN-O tissue. Four animals were not imaged at the earliest time point because of the lack of a visible signal in the other six animals. At the last time point in each row, animals were killed and the mammary fat pads were prepared for ex vivo imaging and histology. (B) Example image. An enlarged view of a maximum-intensity projection of a study mouse showing uptake in various tissues, including the MIN-O tissue in the left and right no. 4 mammary fat pads. The mouse is displayed in a supine orientation. (C) Intensity scale. The color scale representing uptake relative to brain. This color scale is used for all PET images.
Fig. 2.
Fig. 2.
Longitudinal development and malignant transformation; disease development in the single control animal (no. 5475, Upper) and a double MIN-O animal (no. 5476, Lower), each consisting of coronal maximum-intensity projections and transverse slices in the area of disease. In the single control we see increased uptake only in the MIN-O tissue in the right mammary fat pad (indicated by the arrow). The normal endothelial tissue transplant in left mammary fat pad did not exhibit any noticeable increase in uptake. In both cases, the MIN-O tissue has undergone transformation from premalignant neoplasia to invasive carcinoma by 93 days. The development of disease shows a marked increase in uptake as well as growth within the fat pad thickening of the fat pad in later stages.
Fig. 3.
Fig. 3.
Ex vivo PET and histology images. Each row of images corresponds to tissue from a single mammary fat pad. Excised fat pads were fixed in formalin shortly after PET imaging. The tissues were then stained with hematoxylin and imaged for whole-mount slides and subsequently processed to obtain the hematoxylin/eosin-stained sections. Normal epithelial tissue and native lymph nodes (L) exhibit little uptake of 18FDG. MIN-O tissues show preferential uptake from the premalignant stage, increasing throughout the transformation to malignant carcinoma, and in subsequent tumor development. In particular, the third row of images demonstrates increased uptake in the malignant region of the tissue. The histology sections show that this region is marked by a transition from diffuse to solid growth.
Fig. 4.
Fig. 4.
Quantitation plots. (A) Plots show the total uptake of FDG within each segmented lesion as a function of time from transplantation of the MIN-O tissue. Points with a functionally active volume <6 mm3 (roughly the volumetric resolution of the scanner) were excluded because of concern over the accuracy of the segmentation, and animals killed <50 days after tissue transplantation were excluded because of limited data. (B) In vivo and ex vivo measurements of maximum uptake, acquired shortly before tissues were fixed for histological processing to determine the malignancy status. A slope-1 line has been added for reference as well as the uptake threshold of 2.5, which discriminates premalignant and malignant lesions.
Fig. 5.
Fig. 5.
Volume estimates pre- and postmalignant transformation. Data points were sorted into the two categories by using the maximum uptake threshold as the criteria and are plotted as average volume (±1 SE). Exponential growth models were fitted to each data set by using nonlinear regression and are plotted with the data.

References

    1. Cardiff, R. D. & Muller, W. J. (1993) Cancer Surv. 16, 97-113. - PubMed
    1. Cardiff, R. D., Moghanaki, D. & Jensen, R. A. (2000) J. Mamm. Gland Biol. Neoplasia 5, 421-437. - PubMed
    1. Kavanaugh, C. & Green, J. E. (2003) J. Nutr. 133, 2404S-2409S. - PubMed
    1. Cardiff, R. D. (2001) Microsc. Res. Tech. 52, 224-230. - PubMed
    1. Cardiff, R. D. (2003) Comp. Med. 53, 250-253. - PubMed

Publication types

MeSH terms

Substances

LinkOut - more resources