. 2004 Aug 3;101(31):11310-5.
doi: 10.1073/pnas.0404443101. Epub 2004 Jul 26.

RNA dynamics in live Escherichia coli cells

Affiliations

RNA dynamics in live Escherichia coli cells

Ido Golding et al. Proc Natl Acad Sci U S A. .

Abstract

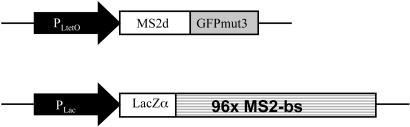
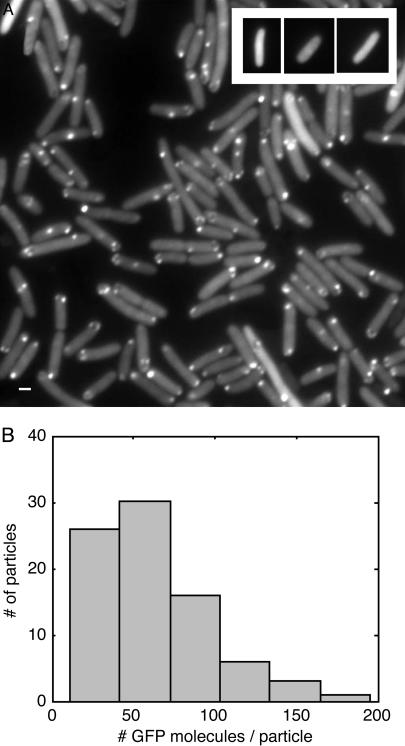
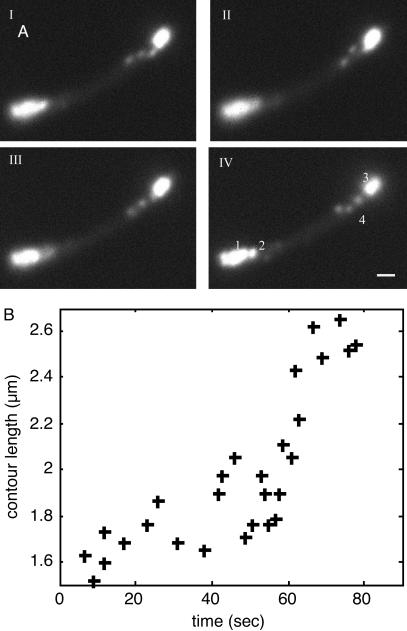
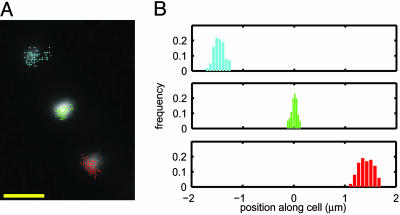
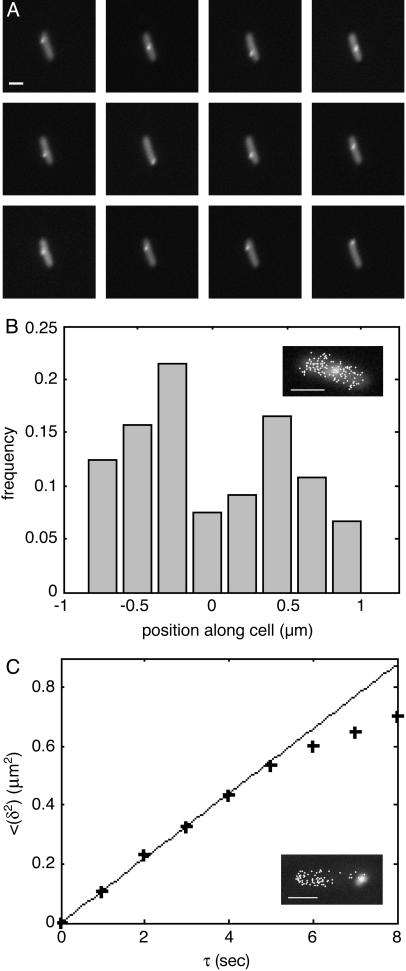
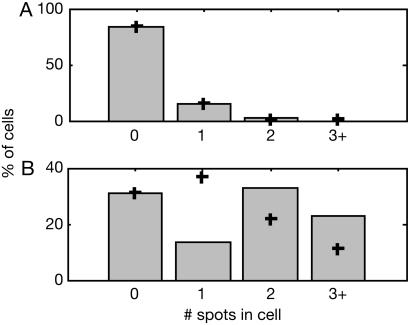
We describe a method for tracking RNA molecules in Escherichia coli that is sensitive to single copies of mRNA, and, using the method, we find that individual molecules can be followed for many hours in living cells. We observe distinct characteristic dynamics of RNA molecules, all consistent with the known life history of RNA in prokaryotes: localized motion consistent with the Brownian motion of an RNA polymer tethered to its template DNA, free diffusion, and a few examples of polymer chain dynamics that appear to be a combination of chain fluctuation and chain elongation attributable to RNA transcription. We also quantify some of the dynamics, such as width of the displacement distribution, diffusion coefficient, chain elongation rate, and distribution of molecule numbers, and compare them with known biophysical parameters of the E. coli system.


Figures

Fig. 1.
Fig. 1.
A schematic description of the constructs used in this study. The MS2 covalent dimer was fused to GFP variant mut3 (GFPmut3). The fusion protein was under the control of the P(LtetO-1) promoter in vector K133 with a ColE1 origin. A tandem array of 96 MS2-binding sites (96x MS2-bs), interspersed by random sequences, was placed under P(Lac) control in vector BAC2 with an F origin. The two plasmids were cotransformed into the E. coli strain DH5α-PRO, a constitutive producer of LacR and TetR repressors.
Fig. 2.
Fig. 2.
GFP-tagged RNA molecules in E. coli cells. (A) Cells carrying BAC2 plus the 96 BS coding sequence and K133 plus MS2d–GFP were grown in LB at 37°C to an OD600 of ≈0.3–0.5. aTc (10 ng/ml) and IPTG (1 mM) were added. After 45–60 min, a few microliters of culture was placed between a coverslip and a thin slab of 0.8% agarose with LB. Cells were observed under epifluorescence, and images were taken at a 100-ms exposure time. As shown in Movies 1 and 2, most spots fluctuate around their mean location. The motion is not inhibited by the addition of 0.2% sodium azide (an inhibitor of ATPase) under conditions where cell growth is completely inhibited in 10 min, suggesting that the motion is passive rather than active. (Scale bar = 1 μm.) (Inset) Absence of spots in cells carrying K133 plus MS2d–GFP and BAC2 without the 96 BS coding sequence. Cells were grown and induced as in A. Cells exhibited low uniform fluorescence of varying levels. (B) Estimation of the number of GFP molecules in each fluorescent particle. Eighty spots were quantified: the histogram of N is shown, where N = (f_spot – f_cell)/(f_GFP). f denotes total photon flux per sec. Fluxes measured were from individual fluorescent spots in the cell (f_spot), background fluorescence in the same cell (f_cell), and individual MS2d–GFP molecules (30 measurements; see supporting information) (f_gfp). Exposure times were 250 msec for cell images and 2.5 sec for single molecules, under identical microscopy conditions. From the histogram we can estimate that each spot corresponds to 20–100 MS2d–GFP molecules (≈70 on average), consistent with our hypothesis that they correspond to single RNA molecules tagged by MS2d–GFP.
Fig. 5.
Fig. 5.
Dynamics of a single RNA molecule. (A) A series of consecutive epifluorescent images taken 1 sec apart. (IV) At the bottom left of the cell are multiple, barely distinguishable spots (1) that do not appear to move, as well as a single spot (2) exhibiting typical localized motion. At the top right is another cluster of spots (3), as well as a chain made from approximately three blobs (4). Based on measured photon fluxes, we estimate that the chain (4) and the single spot at the bottom left (2) consist of a single RNA molecule. The other clusters probably consist of two (3) and three to five (1) molecules each. The polymer chain can be seen to “wiggle” and change its conformation (see Movie 6). We believe that the apparent blob structure of the chain results from parts of the chain being outside the focal plane. (Scale bar = 1 μm.) (B) Estimated contour length of the polymer versus time. The contour was measured manually at different time points. Cells were grown and induced as in Fig. 2. A single cell was tracked by time-lapse photography for 10 min (one frame per sec, with an exposure time of 250 msec; see Movie 6).
Fig. 3.
Fig. 3.
Localized motion of multiple RNA particles in a cell. (A) The measured locations of three individual spots, superimposed on an epifluorescence image of the cell. (Scale bar = 1 μm.) (B) Histograms of spot positions along the cell. Position along the cell was obtained by projecting the spot location (x,y) on the long axis of the cell (xl): xl = x cos θ + y sin θ, where θ is the angle between the long axis of the cell and x axis. Each spot is localized in a small region of the cell, with a bell-shaped distribution of positions. Cells were grown and induced as in Fig. 2. A single cell was tracked for 10 min (one frame per 2 sec, with an exposure time of 250 msec; see Movie 3).
Fig. 4.
Fig. 4.
Two cells exhibiting motion of an RNA particle over the entire cell. Cells were grown and induced as in Fig. 2. (A and B) Cell 1 was tracked for >1h, at one frame per 30 sec (exposure time of 50 msec; see Movie 4). (Scale bars = 1 μm.) (A) A series of epifluorescent images of the cell. Images are 30 sec apart. During the 6 min covered, the RNA particle traveled the length of the cell twice. (B) Histogram of particle position along the cell. Position along the cell was obtained by projecting the spot location (x, y) on the long axis of the cell (see Fig. 3). The spot traversed the entire length of the cell, but the distribution of positions was not uniform. Rather, the particle spent more time away from the center of the cell, closer to the poles (see text). (Inset) Epifluorescence image of the cell, superimposed by measured locations of the RNA spot. (C) Cell 2 was tracked for 2 min, at one frame per sec, with an exposure time of 500 msec (see Movie 5). Mean displacement squared (see text), as a function-of-time interval between measurements. + indicates measurements; solid line indicates linear fit. The linear behavior up to τ ≈ 5 sec suggests that the motion is diffusive. (Inset) Epifluorescence image of the cell, superimposed by measured locations of the RNA spot.
Fig. 6.
Fig. 6.
Induction of RNA transcription. Cells carrying BAC2 plus the 96 BS coding sequence (under control of Plac/ara-1) and K133 plus MS2d–GFP were grown in LB at 37°C to an OD600 ≈ 0.3–0.5. MS2d–GFP production was induced by adding aTc (100 ng/ml). After 1 h, cells were resuspended in the same medium without aTc. RNA transcription was then induced in half of the culture by adding IPTG (1 mM) and L(+)-arabinose (0.1%). Cells were then grown for an additional 1 h and observed as in Fig. 2; 150 cells were examined. (A) Distribution of the number of spots in cells not induced (no IPTG, no arabinose). Each bar represents cells actually counted; + indicates a fit to a Poisson distribution, with λ = 0.18, determined from the number of cells with no spots. Cells with three spots or more were grouped together, because clustered particles are sometimes hard to distinguish. (B) Distribution of the number of spots in induced cells (with IPTG and arabinose). Symbols are as in A. The distribution is bimodal, far from a Poisson distribution (λ= 1.18).

References

    1. Neidhardt, F. C., Ingraham, J. L. & Schaechter, M. (1990) Physiology of the Bacterial Cell: A Molecular Approach (Sinauer, Sunderland, MA).
    1. Neidhardt, F. C. (1996) Escherichia coli and Salmonella: Cellular and Molecular Biology (Am. Soc. Microbiol., Washington, DC).
    1. Errington, J. (2003) Nat. Cell Biol. 5, 175–178. - PubMed
    1. Southward, C. M. & Surette, M. G. (2002) Mol. Microbiol. 45, 1191–1196. - PubMed
    1. Siegele, D. A. & Hu, J. C. (1997) Proc. Natl. Acad. Sci. USA 94, 8168–8172. - PMC - PubMed

Publication types

MeSH terms