. 2004 Aug;78(16):8732-45.
doi: 10.1128/JVI.78.16.8732-8745.2004.

Putative autocleavage of outer capsid protein micro1, allowing release of myristoylated peptide micro1N during particle uncoating, is critical for cell entry by reovirus

Affiliations

Putative autocleavage of outer capsid protein micro1, allowing release of myristoylated peptide micro1N during particle uncoating, is critical for cell entry by reovirus

Amy L Odegard et al. J Virol. 2004 Aug.

Abstract

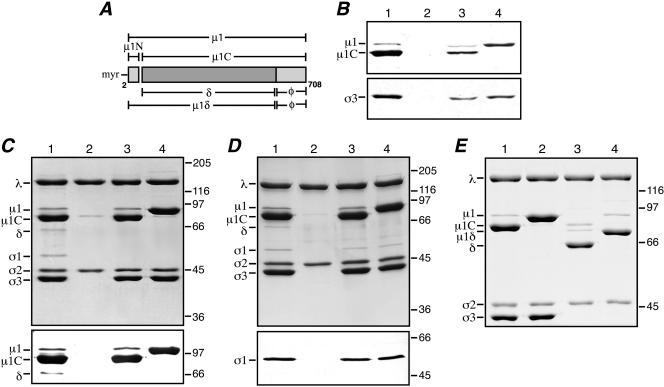
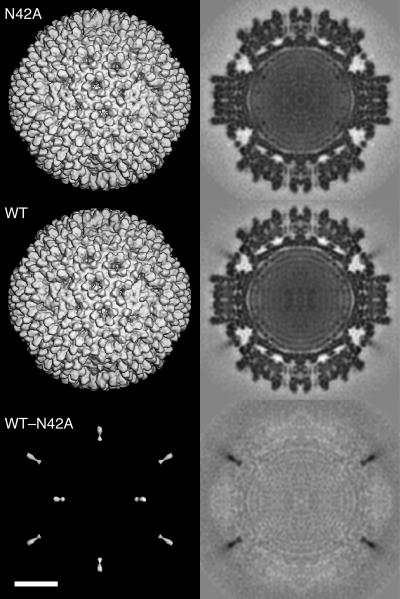
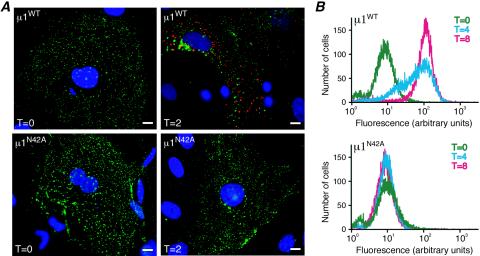
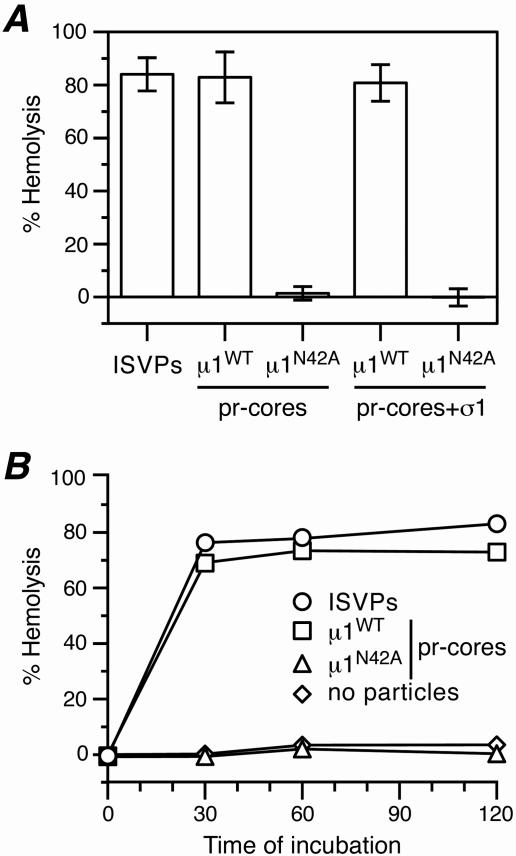
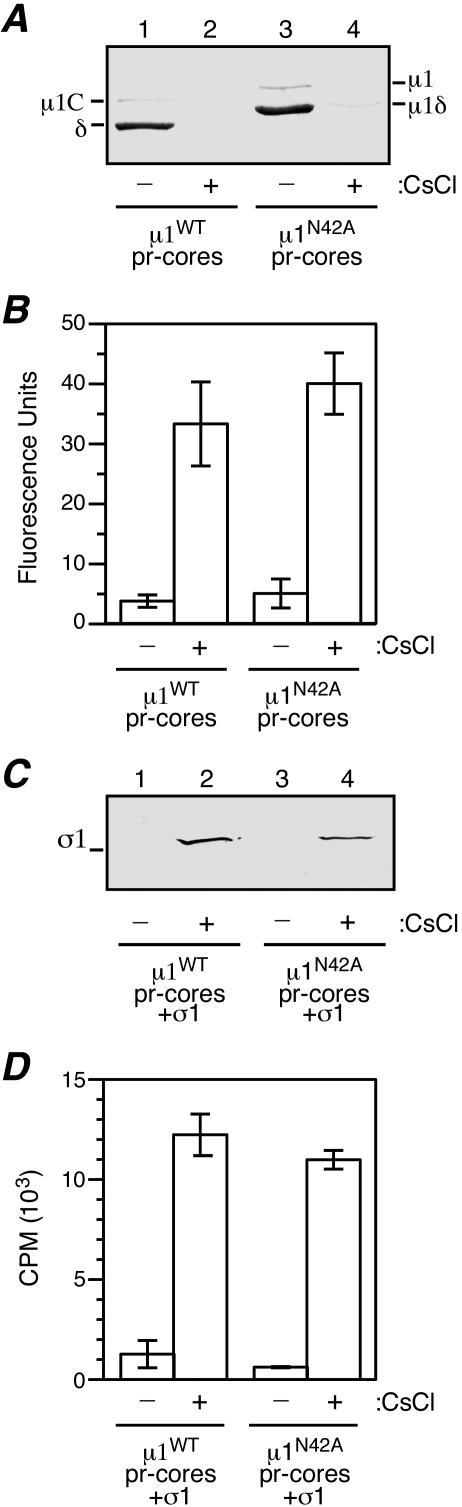
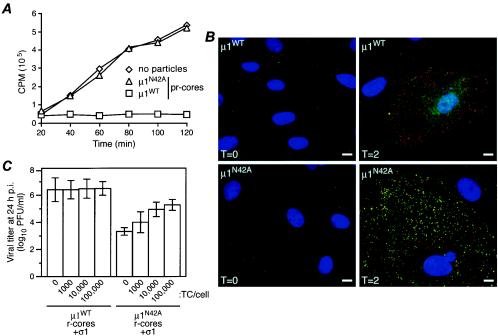
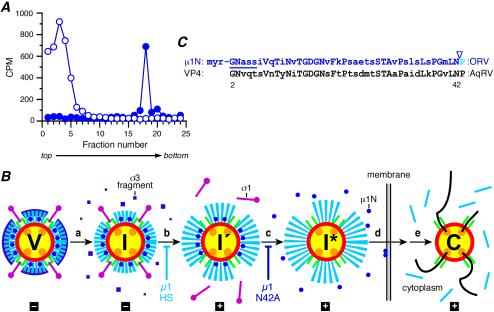
Several nonenveloped animal viruses possess an autolytic capsid protein that is cleaved as a maturation step during assembly to yield infectious virions. The 76-kDa major outer capsid protein micro1 of mammalian orthoreoviruses (reoviruses) is also thought to be autocatalytically cleaved, yielding the virion-associated fragments micro1N (4 kDa; myristoylated) and micro1C (72 kDa). In this study, we found that micro1 cleavage to yield micro1N and micro1C was not required for outer capsid assembly but contributed greatly to the infectivity of the assembled particles. Recoated particles containing mutant, cleavage-defective micro1 (asparagine --> alanine substitution at amino acid 42) were competent for attachment; processing by exogenous proteases; structural changes in the outer capsid, including micro1 conformational change and sigma1 release; and transcriptase activation but failed to mediate membrane permeabilization either in vitro (no hemolysis) or in vivo (no coentry of the ribonucleotoxin alpha-sarcin). In addition, after these particles were allowed to enter cells, the delta region of micro1 continued to colocalize with viral core proteins in punctate structures, indicating that both elements remained bound together in particles and/or trapped within the same subcellular compartments, consistent with a defect in membrane penetration. If membrane penetration activity was supplied in trans by a coinfecting genome-deficient particle, the recoated particles with cleavage-defective micro1 displayed much higher levels of infectivity. These findings led us to propose a new uncoating intermediate, at which particles are trapped in the absence of micro1N/micro1C cleavage. We additionally showed that this cleavage allowed the myristoylated, N-terminal micro1N fragment to be released from reovirus particles during entry-related uncoating, analogous to the myristoylated, N-terminal VP4 fragment of picornavirus capsid proteins. The results thus suggest that hydrophobic peptide release following capsid protein autocleavage is part of a general mechanism of membrane penetration shared by several diverse nonenveloped animal viruses.


Figures

FIG. 1.
FIG. 1.
Expression of μ1N42A, generation of recoated particles, and protease treatment of recoated particles to generate ISVPs. (A) The μ1 protein and its cleavage products are diagrammed. The μ1 N-terminal and C-terminal amino acid positions are labeled 2 and 708, respectively. The autocleavage products μ1N and μ1C are indicated. The N-terminal myristoyl group (myr) is present in both full-length μ1 and μ1N. Cleavage of full-length μ1 by exogenous proteases (e.g., chymotrypsin or trypsin) yields the fragments μ1δ and φ. Cleavage of μ1C by exogenous proteases yields the fragments δ and φ. (B) SDS-PAGE and immunoblotting of insect cell lysates containing either coexpressed μ1WT and wild-type σ3 (lane 3) or μ1N42A and wild-type σ3 (lane 4) was performed. The samples were probed with either the μ1-specific mouse MAb 10H2 (top) or a σ3-specific rabbit polyclonal antiserum (bottom). Virions (lane 1) and cores (lane 2) were included for comparison. (C) Samples of purified μ1WT r-cores (lane 3) and μ1N42A r-cores (lane 4) were examined by SDS-PAGE followed by either Coomassie staining (top) or immunoblotting with μ1-specific MAb 10H2 (bottom). Virions (lane 1) and cores (lane 2) were included for comparison. (D) Samples of purified μ1WT r-cores plus σ1 (lane 3) and μ1N42A r-cores plus σ1 (lane 4) were examined by SDS-PAGE followed by either Coomassie staining (top) or immunoblotting with a σ1-specific rabbit polyclonal antiserum (bottom). Virions (lane 1) and cores (lane 2) were included for comparison. (E) Samples of chymotrypsin-generated μ1WT pr-cores (lane 3) and μ1N42A pr-cores (lane 4) were examined by SDS-PAGE and Coomassie staining. Untreated μ1WT r-cores (lane 1) and μ1N42A r-cores (lane 2) were included for comparison.
FIG. 2.
FIG. 2.
Three-dimensional-image reconstruction of μ1N42A recoated particles. Shown are surface-shaded representations (left) and central, density-coded sections (right) of μ1N42A r-cores (top row) and μ1WT r-cores plus σ1 (middle row) and a difference map obtained by subtracting the densities of the former from those of the latter (bottom row). Both reconstructions, as well as the difference map revealing σ1- but not μ1-related densities, are shown at 17.6-Å resolution. Scale bar, 200 Å.
FIG. 3.
FIG. 3.
Attachment and protein synthesis during infection of cells by recoated particles. (A) CV1 cells were infected with μ1WT pr-cores (top row) or μ1N42A pr-cores (bottom row) (50,000 particles per cell) and then fixed at either 0 (left column) or 2 (right column) h p.i. The fixed cells were coimmunostained with a μNS-specific rabbit polyclonal antiserum followed by Alexa 594-conjugated goat anti-rabbit immunoglobulin G (red) and the μ1-specific mouse MAb 10H2 followed by Alexa 488-conjugated goat anti-mouse immunoglobulin G (green). Cell nuclei were counterstained with 4′,6-diamidino-2-phenylindole (blue). Samples were examined by fluorescence microscopy. (B) Mv1Lu cells were infected with μ1WT pr-cores (top) or μ1N42A pr-cores (bottom) (20,000 particles per cell) and then fixed at either 0 (green), 4 (cyan), or 8 (magenta) h p.i. The fixed cells were stained with μNS-specific rabbit polyclonal antiserum followed by Alexa 488-conjugated goat anti-rabbit immunoglobulin G. Samples were examined by flow cytometry.
FIG. 4.
FIG. 4.
Hemolysis by μ1N42A recoated particles. (A) Samples of native ISVPs, μ1WT pr-cores (with or without σ1), or μ1N42A pr-cores (with or without σ1) were incubated with bovine calf erythrocytes (final concentration, 3% [vol/vol]) at 32°C for 30 min in the presence of 200 mM CsCl. The reactions were terminated by incubation on ice for 10 min, and the cells were pelleted by centrifugation at 300 × g for 5 min. The extent of hemolysis was determined by measuring the A405 of the supernatant and was expressed as a percentage (hemolysis by 1% Triton X-100 = 100%). Each bar represents the mean ± standard deviation from three trials. (B) Samples of μ1WT or μ1N42A pr-cores were evaluated for hemolysis as described for panel A, except that samples were harvested for analysis after different periods at 32°C. The results of a representative experiment are shown. Use of CsCl as a promoting agent is discussed in Materials and Methods.
FIG. 5.
FIG. 5.
Capacity of μ1N42A recoated particles to undergo the ISVP → ISVP* transition. (A) Protease sensitivity of μ1. Samples of μ1WT pr-cores plus σ1 (lanes 1 and 2) or μ1N42A pr-cores plus σ1 (lanes 3 and 4) were incubated with bovine erythrocytes, and hemolysis was performed as for Fig. 4 in the presence of CsCl or NaCl (200 mM). Following incubation at 32°C and removal to ice, the samples were incubated with trypsin (100 μg/ml) for 45 min on ice. The trypsin was then inactivated by addition of soybean trypsin inhibitor (300 μg/ml). Samples were subjected to SDS-PAGE, followed by immunoblotting with the μ1-specific MAb 10H2. (B) Hydrophobicity. Samples of μ1WT or μ1N42A pr-cores plus σ1 were incubated in reaction buffer containing bis-ANS (25 μM) and either NaCl or CsCl (300 mM) for 30 min at 32°C. The levels of bis-ANS fluorescence were then measured on a fluorescence microplate reader (Spectramax; Molecular Dynamics) (excitation, 405 nm; emission, 485 nm). The results of a representative experiment are shown. (C) Release of σ1. Samples of μ1WT pr-cores plus σ1 (lanes 1 and 2) or μ1N42A pr-cores plus σ1 (lanes 3 and 4) were incubated in reaction buffer containing either CsCl or NaCl (300 mM) for 30 min at 32°C. The samples were removed to ice for 10 min and then loaded atop a sucrose cushion (20% [wt/vol]; 500 μl). Following centrifugation in a Beckman TLA 100.2 rotor (90,000 rpm for 1 h at 5°C), the top fraction (200 μl) of the sucrose cushion was removed, concentrated by precipitation with trichloroacetic acid, and subjected to SDS-PAGE, followed by immunoblotting with a σ1-specific rabbit polyclonal antiserum. (D) Transcriptase activation. Samples of μ1WT or μ1N42A pr-cores plus σ1 were incubated in reaction buffer containing either CsCl or NaCl (300 mM) for 30 min at 32°C. The samples were removed to ice for 10 min and then incubated in transcription reaction buffer (see Materials and Methods) containing [α-32P]GTP at 37°C for 105 min. RNA products were concentrated by precipitation with trichloroacetic acid, and the radioactivity in each sample was measured by scintillation counting. Each bar represents the mean ± standard deviation from three separate trials. Use of CsCl as a promoting agent is discussed in Materials and Methods.
FIG. 6.
FIG. 6.
Behaviors of μ1N42A recoated particles in cells. (A) Coentry of α-sarcin during viral infection. L929 cells were incubated with μ1WT or μ1N42A pr-cores plus σ1 at 4°C to allow attachment, washed with methionine-free medium containing [35S]methionine-cysteine with or without α-sarcin (50 μg/ml), and incubated at 37°C for different times, as indicated. The cells were then lysed, and macromolecules were concentrated by trichloroacetic acid precipitation. The radioactivity (in counts per minute) in the washed precipitates was measured by scintillation counting. The values shown represent the average of two experiments, each done in duplicate. (B) Antibody-detected structural changes in infected cells. CV1 cells were infected with μ1WT pr-cores plus σ1 (top row) or μ1N42A pr-cores plus σ1 (bottom row) (50,000 particles per cell) and then fixed at either 0 (left column) or 2 (right column) h p.i. The fixed cells were coimmunostained with a core-specific rabbit polyclonal antiserum followed by Alexa 594-conjugated goat anti-rabbit immunoglobulin G (red) and the μ1-specific mouse MAb 4A3 followed by Alexa 488-conjugated goat anti-mouse immunoglobulin G (green). Cell nuclei were counterstained with 4′,6-diamidino-2-phenylindole (blue). Samples were examined by fluorescence microscopy. (C) Rescue of infectivity by top component. L929 cell monolayers were coinfected with μ1WT or μ1N42A r-cores plus σ1 (1,000 per cell) plus top component particles (0, 1,000, 10,000, or 100,000 per cell). After 24 h at 37°C, the cells were lysed, and infectious titers were determined by plaque assay. Samples of cells infected with each amount of top component particles alone were identically generated and analyzed in parallel. Within each experiment, the latter titers were subtracted from the respective former titers to correct for any residual infectivity of the top component. Each bar represents the mean ± standard deviation of the results from three separate experiments.
FIG. 7.
FIG. 7.
μ1N release from ISVP*s, model, and sequences. (A) μ1N release from ISVP*s. [3H]myristate-labeled ISVPs were incubated with either 300 mM NaCl (solid circles) or 300 mM CsCl (open circles) in the presence of 0.5% Triton X-100 for 30 min at 32°C. The particles were then purified on a 1.25- to 1.45-g/cm3 CsCl density gradient. The gradients were fractionated, and the radioactivity (in counts per minute) in each sample was measured by scintillation counting. The results of a representative experiment are shown. (B) Updated model of reovirus uncoating in vitro and during cell entry. Interactions of viral particles and proteins with cell surface receptors and possible localizations to specific subcellular compartments are not included in the diagram. The proposed uncoating intermediates and fates of the outer capsid proteins—μ1N (blue), μ1C (cyan), σ1 (magenta), and σ3 (purple)—are shown. (Step a) The virion (V) undergoes proteolytic processing to generate the ISVP (I). In ISVPs, the σ3 protein has been degraded, and its differently sized fragments have been released. (Step b) The ISVP then undergoes a major structural transition to the ISVP′ (I′). ISVP′s lack σ1 and contain an altered, hydrophobic conformer of μ1. Particles containing μ1HS are blocked at step b (18). (Step c) The ISVP′ then undergoes a further transition to the ISVP* (I*), during which the remaining μ1N/μ1C cleavage occurs and the μ1N peptide is released. As suggested in the diagram (by the increase in particle diameter), further conformational changes in μ1C seem likely to accompany this transition. Particles containing μ1N42A are blocked at step c. (Steps d and e) The released μ1N peptides, putatively in concert with other portions of μ1C remaining in the ISVP*, effects membrane penetration (step d), and transcriptionally active core particles (C) are ultimately released into the cytoplasm (step e). The capacity of each particle type to mediate viral transcription is indicated below the diagram (+, able to mediate; −, unable to mediate). Note that cleavage of μ1C at the δ-φ junction during generation of ISVPs is not shown in this diagram, because the fate of φ during and after membrane penetration remains unknown. The cyan lines accompanying the core after step e specifically represent the released δ fragment (18). (C) Sequence comparison of the N-terminal regions of orthoreovirus (ORV) μ1 and aquareovirus (AqRV) VP4 proteins. Amino acids 2 to 43 of μ1 are shown on top, with corresponding residues of VP4 aligned below. Identical residues are shown in uppercase. The myristoylation consensus sequence in both proteins is indicated by the line. The N-terminal N-myristoyl group of μ1 is labeled (myr), and the site of the putative autocleavage is indicated by the arrowhead. The myristoyl group plus amino acids 2 to 42 constitute the μ1N peptide.

Similar articles

Cited by

References

    1. Ansardi, D. C., and C. D. Morrow. 1995. Amino acid substitutions in the poliovirus maturation cleavage site affect assembly and result in accumulation of provirions. J. Virol. 69:1540-1547. - PMC - PubMed
    1. Attoui, H., Q. Fang, F. M. Jaafar, J. F. Cantaloube, P. Biagini, P. De Micco, and X. De Lamballerie. 2002. Common evolutionary origin of aquareoviruses and orthoreoviruses revealed by genome characterization of Golden shiner reovirus, Grass carp reovirus, Striped bass reovirus and golden ide reovirus (genus Aquareovirus, family Reoviridae). J. Gen. Virol. 83:1941-1951. - PubMed
    1. Baker, T. S., and R. H. Cheng. 1996. A model-based approach for determining orientations of biological macromolecules imaged by cryo-electron microscopy. J. Struct. Biol. 116:120-130. - PubMed
    1. Baker, T. S., N. H. Olson, and S. D. Fuller. 1999. Adding the third dimension to virus life cycles: three-dimensional reconstruction of icosahedral viruses from cryo-electron micrographs. Microbiol. Mol. Biol. Rev. 63:862-922. - PMC - PubMed
    1. Barton, E. S., J. C. Forrest, J. L. Connolly, J. D. Chappell, Y. Liu, F. J. Schnell, A. Nusrat, C. A. Parkos, and T. S. Dermody. 2001. Junction adhesion molecule is a receptor for reovirus. Cell 104:441-451. - PubMed

Publication types

LinkOut - more resources