. 2004 Sep;23(1):1-25.
doi: 10.1002/hbm.20045.

Spatiotemporal wavelet resampling for functional neuroimaging data

Affiliations

Spatiotemporal wavelet resampling for functional neuroimaging data

Michael Breakspear et al. Hum Brain Mapp. 2004 Sep.

Abstract

The study of dynamic interdependences between brain regions is currently a very active research field. For any connectivity study, it is important to determine whether correlations between two selected brain regions are statistically significant or only chance effects due to non-specific correlations present throughout the data. In this report, we present a wavelet-based non-parametric technique for testing the null hypothesis that the correlations are typical of the data set and not unique to the regions of interest. This is achieved through spatiotemporal resampling of the data in the wavelet domain. Two functional MRI data sets were analysed: (1) Data from 8 healthy human subjects viewing a checkerboard image, and (2) "Null" data obtained from 3 healthy human subjects, resting with eyes closed. It was demonstrated that constrained resampling of the data in the wavelet domain allows construction of bootstrapped data with four essential properties: (1) Spatial and temporal correlations within and between slices are preserved, (2) The irregular geometry of the intracranial images is maintained, (3) There is adequate type I error control, and (4) Expected experiment-induced correlations are identified. The limitations and possible extensions of the proposed technique are discussed.


Figures

Figure 1
Figure 1
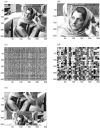
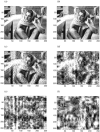
Standard test images used to illustrate the wavelet resampling scheme (a,b). Example of permutation schemes (operating on the raw image in a). c: Random permutation of rows and then columns. d: Resampling in 12 × 12 blocks. e: Cyclic rotation of rows and then columns.
Figure 2
Figure 2
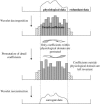
Schema illustrating how resampling is constrained to within physiological domain. The first step requires partition of the physiological domain from redundant data (with zero variance). After transforming the data into the wavelet domain, the coefficients that are located within, or on the boundary, of this domain are permuted amongst themselves. This procedure occurs on each level of the multi‐scale decomposition. Data are then reconstructed from the permuted coefficients within this domain and those outside it, which are left invariant. Any non‐zero data outside of the original physiological domain (dotted lines) at the end of the procedure are reset to zero. Hence, there is some loss of power, which can be rectified through renormalization.
Figure 3
Figure 3
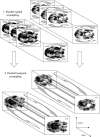
Schema of the two‐step resampling procedure. In step 1, each slice and at each time point is spatially resampled. The resampling procedure is identical at the same scale for each time point and each slice. Resampling at different scales is independent. In step 2, the time series from each voxel (three shown in each slice) from the spatially wavestrapped data is resampled in the temporal dimension. The resampling procedure at the same scale for each voxel is identical. All resampling is performed in the wavelet domain after appropriate wavelet decomposition (two‐dimensional for step 1 and one‐dimensional for step 2).
Figure 9
Figure 9
a: Horizontal spatial cross‐spectrum the images in Figure 1a,b. Corresponding cross‐spectra (b) of an ensemble of 19 surrogate sets produced by random permutation of detail coefficients. Cross‐spectra produced by (c) resampling in blocks of 12 adjacent coefficients and (d) cyclic rotation of detail coefficients.
Figure 10
Figure 10
a: Horizontal spatial spectrum of a motion‐corrected fMRI slice. Spatial spectra produced by resampling wavelet coefficients using (b) Daubechies wavelets of order 4 and (c) order 6
Figure 4
Figure 4
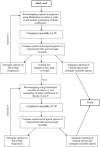
General principles followed to choose wavelet basis functions and resampling scheme. Procedure commences with random resampling and wavelet basis functions of low order, m = 2. This order is increased until there is an adequate matching of the spectra (→ finish) or isolated bias in the spectra appear (due to edge of effects of high order basis functions). If this occurs, m is reset to m‐1 and the coefficients are resampled in small blocks of N = 2. The size of the blocks is increased (NN+1) until there is an adequate matching the spectra. If N approaches half of the length of the number of coefficients, then cyclic rotation is employed.
Figure 5
Figure 5
Effect of resampling in the wavelet domain at different spatial scales. a: Scale 1 only. b: Scales 1–2. c: Scales 1–3. d: Scales 1–4. e: Scales 1–8 (effectively all scales). f: Scales 4–8. Daubechies wavelets of order 12 were used.
Figure 6
Figure 6
Restriction of resampling of detail coefficients to within a central ellipse with a horizontal axis of 200 voxels and a vertical axis of 140 voxels. Coefficients outside this sphere were not permuted. Black (superimposed) curves show extent of sphere.
Figure 7
Figure 7
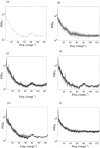
a: Horizontal spatial spectrum of the image in Figure 1a. b: Corresponding horizontal spectra of an ensemble of 19 surrogate sets produced by random permutation of detail coefficients. c: Horizontal spectra produced by resampling in blocks of 12 adjacent detail coefficients. d: Horizontal spectra produced by cyclic rotation of detail coefficients. e: Horizontal spectra produced after restricting random permutation of detail coefficients to all scales other then the finest. f: Horizontal spectra produced by random permutation of coefficients (a) plus additive Gaussian noise. For all panels, Daubechies wavelets of order 12 were employed.
Figure 8
Figure 8
Visual representation of spatial wavestrapping at all spatial scales. a: Random permutation; b: Resampling in blocks of 10x10 coefficients; c: Cyclic resampling.
Figure 11
Figure 11
The horizontal spatial cross‐spectrum between two adjacent slices in one subject (solid line) and cross‐spectra produced by resampling coefficients using a Daubechies wavelet of order 6 (dashed line).
Figure 12
Figure 12
Temporal spectrum (PSDT) of original data (solid line) and surrogate data (dashed line). (a:) PSDT following parallel spatial resampling using Daubechies wavelets of order 6. b,c: The effect of subsequent temporal resampling on these spatially wavestrapped data, using (b) Daubechies wavelets of order 8 in 5 blocks and (c) Daubechies wavelets of order 10 and random permutation. Note the increase in variance in b and c.
Figure 13
Figure 13
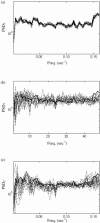
Horizontal (PSDH) spatial spectra of the original data (solid line) and surrogate (dashed line). a: Spatial spectra following parallel temporal resampling with Daubechies wavelets of order 10. Subsequent spatial resampling on these temporally wavestrapped data, using Daubechies wavelets of order 6 (b) and 8 (c).
Figure 14
Figure 14
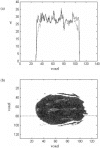
Mean of the root‐mean‐square of the difference between the experimental BOLD and surrogate time series, voxel by voxel. a: Cross‐section through a slice, showing results after spatial wavestrapping (dashed line) and spatiotemporal wavestrapping (solid line). Note somewhat steeper “edges” after both steps have been completed. b: Grey‐scale results from an entire image. Dotted line shows location of the cross‐section in a.
Figure 15
Figure 15
Amplitude histogram of fMRI data (black), spatially wave‐strapped data (light gray) and spatio‐temporal wavestrapped data (dark grey). The BOLD value in each pixel at all time points was extracted and the resulting values are plotted on an amplitude histogram. x‐axis is the value of the BOLD signal and the y‐axis gives the number of voxels with that signal value.
Figure 16
Figure 16
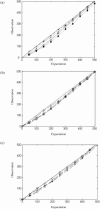
Expected versus observed rate of null hypothesis rejection in the eyes‐closed resting state fMRI data set. a: Results following first subject, one slice after spatial wavestrapping using daubechies wavelets of order 6 (crosses, dashed line) and then subsequent temporal resampling (dotted lines) using wavelets of order 10 and random resampling (black dots), 8 and cyclic rotation (crosses), 8 and random resampling (open circles), 8 and resampling in 4 blocks (diamonds). Results from second (b) and third (c) subjects showing temporal resampling (dotted line) using Daubechies wavelets of order 6, and then spatial resampling using wavelets of order 4 (crosses), 6 (diamonds), and 8 (black dots).
Figure 17
Figure 17
Exemplar data from visual stimulation paradigm. a,b: Time series of BOLD from two “strongly activated” pixels in visual cortex (solid line) and corresponding surrogate realizations (dashed line). c: Corresponding temporal cross‐spectral density function. Pearson's correlation coefficient for the original data was r exp = 0.794 and for the surrogate r surr = 0.637 (the median for this surrogate ensemble).

Similar articles

Cited by

References

    1. Andrzejak RG, Kraskov A, Stogbauer H, Mormann F, Kreuz T (2004): Bivariate surrogate techniques: necessity, strengths and caveats. Phys Rev E 68: 066202. - PubMed
    1. Brammer MJ, Bullmore ET, Simmons A, Williams SCR, Grasby PM, Howard RJ, Woodruff PWR, Rabe‐Hesketh S (1997): Generic brain activation in functional magnetic resonance imaging: A non‐parametric approach. Magnet Reson Imag 15: 763–770. - PubMed
    1. Breakspear M, Terry J (2002a): Detection and description of nonlinear interdependence in normal multichannel human EEG. Clin Neurophysiol 113: 735–753. - PubMed
    1. Breakspear M, Terry J (2002b): Topographic organisation of nonlinear interdependence in multichannel human EEG. Neuroimage 16: 822–825. - PubMed
    1. Breakspear M, Brammer MJ, Robinson PA (2003): Construction of multivariate surrogate sets from nonlinear data using the wavelet transform. Physica D 182: 1–22.

Publication types

LinkOut - more resources