. 2004 Jul 28;24(30):6816-25.
doi: 10.1523/JNEUROSCI.1449-04.2004.

On the activity of the corticostriatal networks during spike-and-wave discharges in a genetic model of absence epilepsy

Affiliations

On the activity of the corticostriatal networks during spike-and-wave discharges in a genetic model of absence epilepsy

Seán J Slaght et al. J Neurosci. .

Abstract

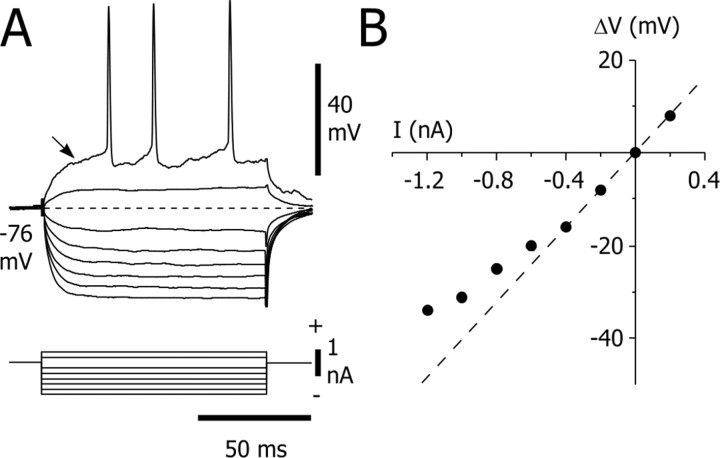
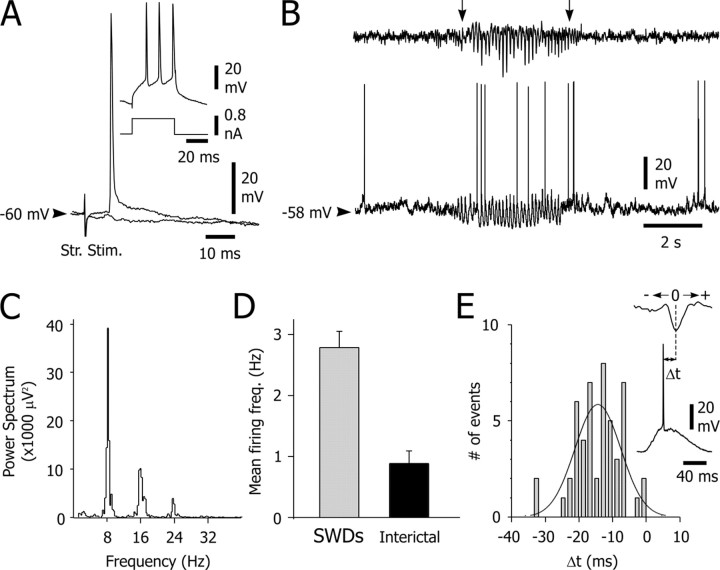
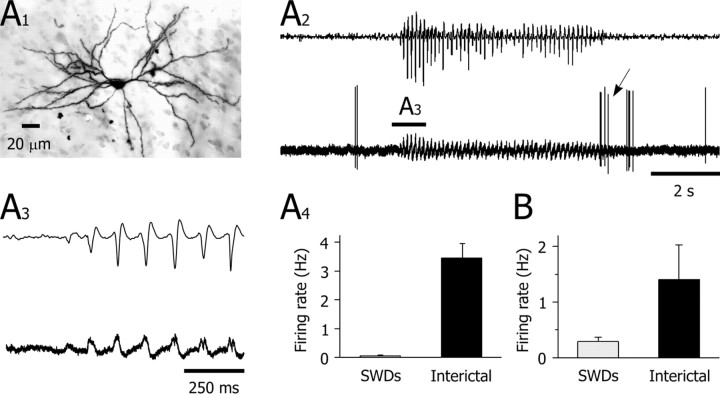
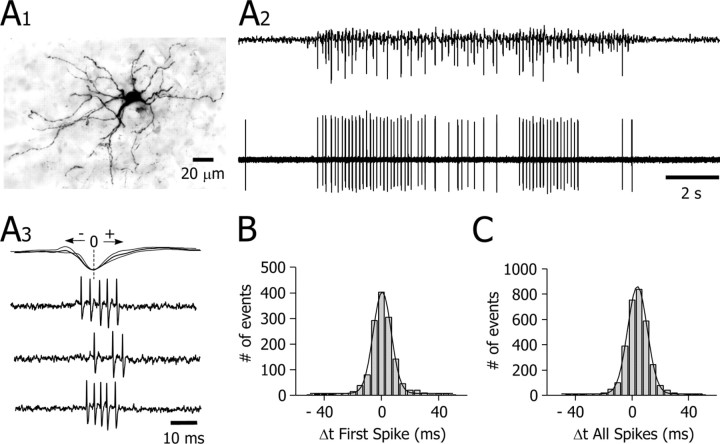
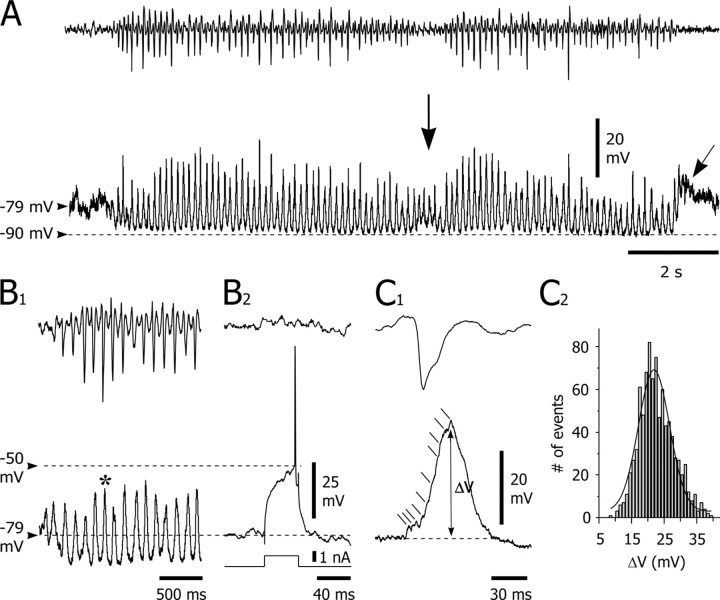
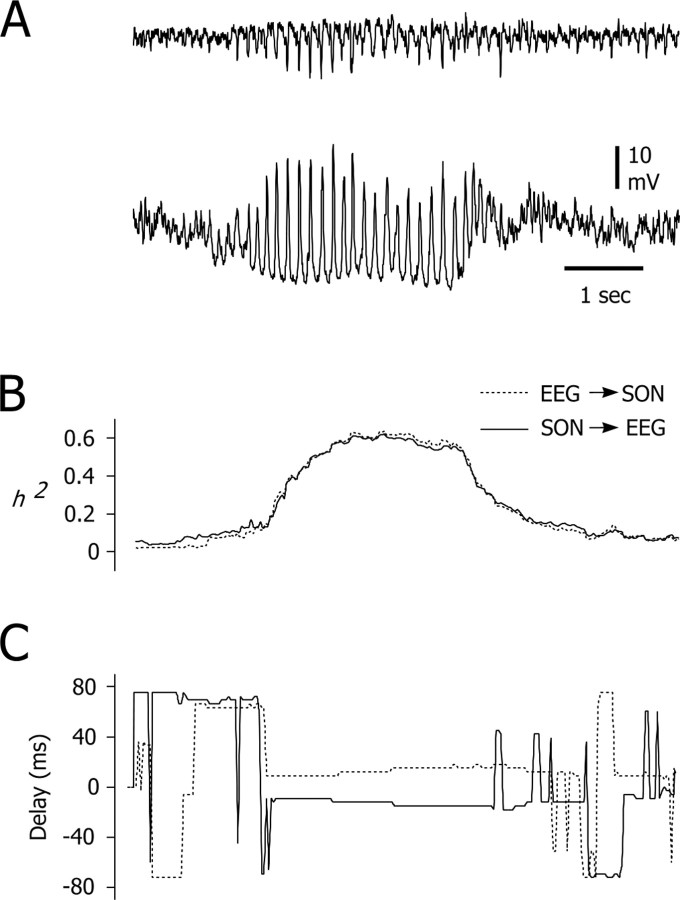
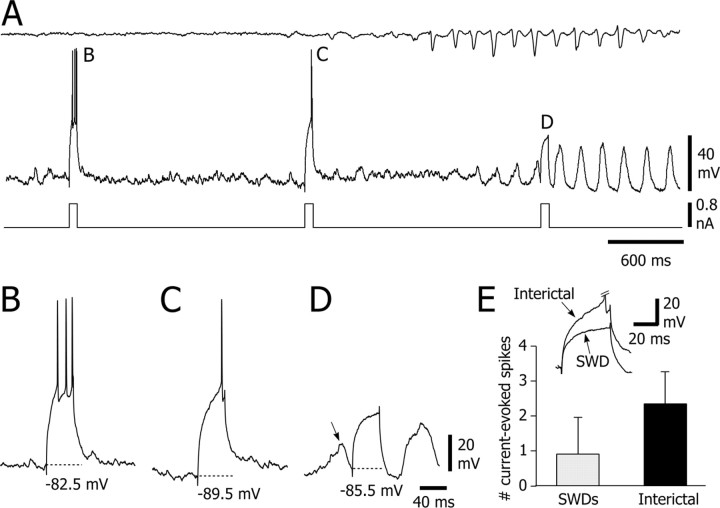
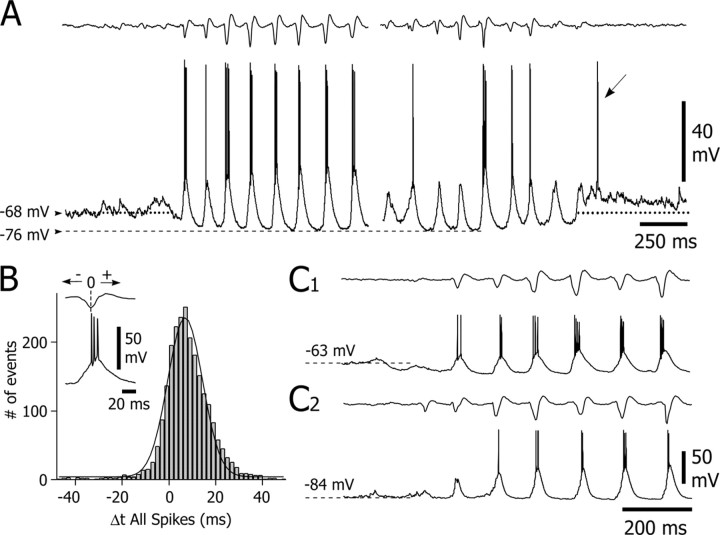
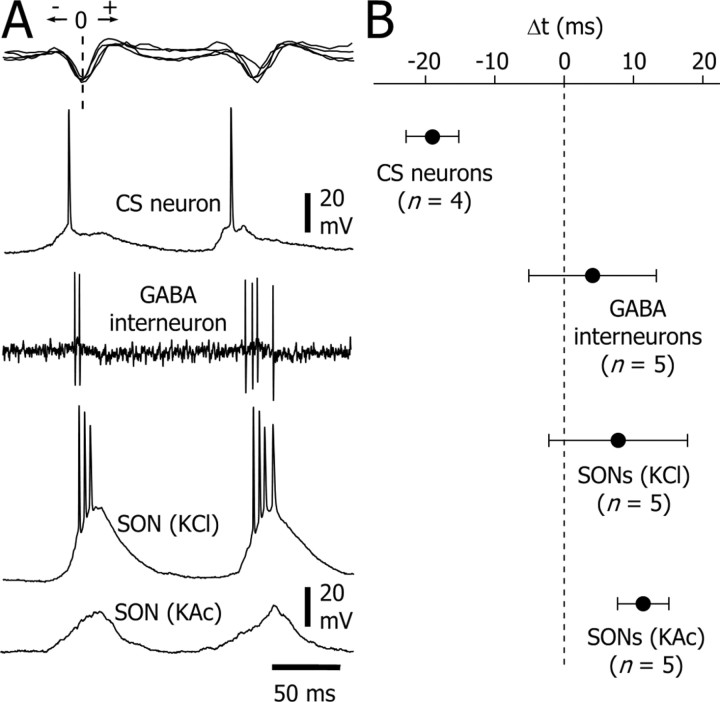
Absence seizures are characterized by impairment of consciousness associated with widespread bilaterally synchronous spike-and-wave discharges (SWDs) in the electroencephalogram (EEG), which reflect highly synchronized oscillations in thalamocortical networks. Although recent pharmacological studies suggest that the basal ganglia could provide a remote control system for absence seizures, the mechanisms of propagation of epileptic discharges in these subcortical nuclei remain unknown. In the present study, we provide the first description of the electrical events in the corticostriatal pathway during spontaneous SWDs in the genetic absence epilepsy rats from Strasbourg (GAERS), a genetic model of absence epilepsy. In corticostriatal neurons, the SWDs were associated with suprathreshold rhythmic depolarizations in-phase with local EEG spikes. Consistent with this synchronized firing in their excitatory cortical afferents, striatal output neurons (SONs) exhibited, during SWDs, large-amplitude rhythmic synaptic depolarizations. However, SONs did not discharge during SWDs. Instead, the rhythmic synaptic excitation of SONs was shunted by a Cl(-)-dependent increase in membrane conductance that was temporally correlated with bursts of action potentials in striatal GABAergic interneurons. The reduced SON excitability accompanying absence seizures may participate in the control of SWDs by affecting the flow of cortical information within the basal ganglia circuits.


Figures

Figure 3.
Figure 3.
Electrical membrane properties of GAERS striatal output neurons. A, Voltage responses of a striatal output neuron (top traces) to a series of hyperpolarizing and depolarizing square current pulses (bottom traces). The traces represent the average of 15 successive trials, except the suprathreshold response evoked by a single positive current pulse. Note the slow ramp-like depolarization (arrow) that preceded the action potential discharge. The value of the resting membrane potential (dashed line) is indicated. B, The plot of voltage changes (ΔV) as a function of the injected current (I) was constructed from the responses shown in A. The apparent input resistance of this cell (40 MΩ) was calculated from the linear segment (dashedline) of the I-V curve. Note the rectification of the membrane potential in response to hyperpolarizing currents less than -0.4 nA.
Figure 1.
Figure 1.
Intracellularly recorded activity of CS neurons during SWDs. A, CS neurons were identified by their antidromic activation after electrical stimulation of the contralateral striatum (Str. Stim.). As shown by the superimposed traces, the activation of CS neurons using a threshold stimulus was obtained in the absence of an underlying synaptic potential. Inset, Response of the CS cell (top trace) to intracellular injection of a suprathreshold square current pulse (bottom trace). B, Spontaneous intracellular activity of the CS neuron (bottom trace) simultaneously recorded with the EEG (top trace). The SWD was concomitant with rhythmic membrane depolarizations in the CS neuron, which could trigger action potentials in-phase with the corresponding spike-wave complex in the EEG (see E, inset). C, The power spectrum of the SWD shown in B reveals a dominant frequency of ∼8 Hz. D, The mean firing frequency of the CS neuron was significantly (p < 0.001) increased during the SWDs (n = 13) compared with the interictal periods. E, Histogram of corticostriatal action potential arrival times (Δt) distribution (n = 50 spikes; bin size, 2 msec). As shown in the inset, the zero-time reference was taken as the peak of the corresponding EEG spike. Δt was distributed around a mean value of -15.7 ± 6.8 msec and was fitted with a Gaussian-Laplace curve (r2 = 0.51). Results presented in A-E are from the same cell-EEG pair.
Figure 2.
Figure 2.
Extracellularly recorded activity of SON during SWDs. A1, Synthetic projection micrograph (from a 400-μm-thick whole mount) of a striatal output neuron labeled by juxtacellular injection of neurobiotin. This cell exhibited the characteristic morphological features of striatal output neurons (for a detailed description, see Results). A2, The occasional spontaneous firing of the striatal cell (bottom trace) was interrupted during the SWD (top trace). An oscillatory field potential was maintained throughout the crisis. Note the rebound of firing at the end of the SWD (oblique arrow). A3, The EEG record (top trace) and the corresponding striatal field potential (bottom trace) during the start of the SWD (as shown in A2). A4, The mean spike firing frequency calculated from the interictal periods (n = 11) was dramatically decreased during the SWDs (n = 10) (p < 0.001). B, Pooled data from 10 cells showing the significant (p < 0.05) diminution of the mean spontaneous firing rate of striatal output neurons during absence seizures. Results depicted in A1-A4 are from the same cell.
Figure 8.
Figure 8.
Bursting activity in GABAergic striatal interneurons during SWDs. A1, Synthetic projection micrograph (from a 400-μm-thick whole mount) of a GABAergic striatal interneuron labeled by juxtacellular injection of neurobiotin. This cell exhibited the distinctive morphological features (for a detailed description, see Results) of striatal interneurons immunoreactive for GABA (Kawaguchi, 1993). A2, A3, Extracellular recording of the labeled neuron shown in A. This cell displayed, during the cortical seizure (A2, top trace), recurrent bursts of action potentials (A2, bottom trace) concomitant with the spike-wave complexes in the EEG (A3). B, C, Histograms and Gaussian-Laplace fits (black lines) showing the latency (Δt) of the first and all of the action potentials, respectively, in a burst with respect to the peak negativity of the EEG spike (taken as zero-time reference; A3) (n = 1402 bursts from 5 cells; bin size, 5 msec). Note that the start of bursts was in-phase with the EEG spike (B) and that most action potentials occurred 0-15 msec after the EEG spike (C).
Figure 4.
Figure 4.
Intracellular activity of SONs during SWDs. A, The occurrence of an SWD in the EEG (top trace) was accompanied, in the recorded SON (bottom trace), by rhythmic membrane depolarizations superimposed on a sustained hyperpolarization (dashed line). A momentary interruption of the SWD was concomitant with an attenuation of the tonic hyperpolarization and a decrease in amplitude of the rhythmic depolarizations (vertical arrow). The end of ictal activity was succeeded by a rebound of membrane depolarization (oblique arrow). B, The rhythmic membrane depolarizations remained subthreshold for spike discharge. The rhythmic depolarizations (B1, bottom trace) associated with the SWD (B1, top trace) did not cause the cell to fire. The voltage firing threshold (-50 mV) was measured from the same cell during an interictal period (B2, middle trace), by intracellular injection of a positive square current pulse (1 nA) (B2, bottom trace) from a membrane potential corresponding to the preictal level of cell polarization (-79 mV). C, Properties of membrane depolarizations. C1, Expansion (asterisk in B1) of a spike-wave complex (top trace) and its cellular correlate in the simultaneously recorded SON (bottom trace). The large-amplitude depolarization was progressively sculpted by the summation of high-frequency depolarizing events (oblique lines). The full amplitude of the membrane depolarizations (ΔV) was measured (double arrow) from the baseline (dashed line) to the peak potential. C2, Pooled distribution of the amplitude of membrane depolarizations associated with spike-wave complexes (n = 888 from 80 SWDs; bin size, 1 mV; n = 10 cells). Amplitude of cellular depolarizations was measured as indicated in C1. The amplitude distribution was Gaussian (r2 = 0.92) and distributed around a mean of 22.8 mV (± 0.18 mV). Records shown in A and B-C1 are from two different neurons that did not spontaneously discharge action potentials.
Figure 5.
Figure 5.
Temporal evolution of the relationships between EEG and intracellular activities of SONs. A, Typical EEG paroxysm (top trace) and its intracellular correlate in a simultaneously recorded SON (bottom trace). B, Time course of the strength of association between the cortical and striatal activities shown in A. The nonlinear correlation indices h2 (EEG → SON, dashed line; SON → EEG, continuous line) were calculated for successive 2 sec windows with a temporal overlapping of 98%. C, Corresponding time delays. The time lag values fluctuated before and after the SWD but were relatively constant during the seizure. This result indicates a unidirectional coupling, from the cortex to the SONs, with a delay of ∼15 msec. The traces in A and the corresponding analysis in B and C are temporally aligned.
Figure 6.
Figure 6.
Decrease in SON excitability during SWD-associated rhythmic depolarizations. A, Voltage responses of an SON (middle trace) to repetitive (every 1.5 sec) injection of square current pulses (0.8 nA; bottom trace) applied during interictal (B, C) and ictal (D) periods in the EEG (top trace). B-D, expansion of the traces indicated by the corresponding letters in A. The injected current initiated action potential discharge during the interictal epoch (B, C) but was subthreshold when coincident with a large membrane depolarization (arrow) occurring during the SWD (D). The dashed lines indicate the membrane potential at the start of the pulse. E, The number of current-evoked action potentials during SWDs was significantly decreased compared with interictal periods (n = 10 pulses for each period; p < 0.001). Inset, Superimposition of the records depicted in C and D. Although the current pulse was injected, during the SWD, from a membrane potential slightly more depolarized than that of the interictal period (compare membrane potentials in C and D), it caused a smaller depolarization that remained subthreshold for action potential generation. The action potential evoked during the interictal activity is truncated. Data shown in A-E are from the same cell.
Figure 7.
Figure 7.
Intracellular activity of SONs recorded with KCl-filled microelectrodes. A, The start and the end of an SWD recorded from a Cl--loaded SON. In contrast with the recordings obtained with KAc electrodes (see Figs. 4, 5, 6), SONs recorded with KCl electrodes (bottom trace) had an interictal membrane potential (dotted line) slightly more depolarized and, during SWDs (top trace), exhibited rhythmic depolarizing potentials that could generate bursts of action potentials. Two features were preserved: the tonic membrane hyperpolarization (dashed line) and the postictal rebound (oblique arrow). B, Distribution of the delays of the first action potential relative to the EEG spike component (inset). The pooled distribution (n = 2357 action potentials from 5 cells; bin size, 2 msec; mean = 7.8 ± 0.2 msec) was fitted bya Gaussian curve (r2 = 0.98). C, Intracellular activity of a Cl--loaded SON, at the start of an SWD, recorded from the resting potential (C1) and during maintained hyperpolarization to -84 mV by DC injection (C2). The frequency of the rhythmic depolarizations did not depend on the membrane polarization, and the cell still fired action potentials despite the substantial hyperpolarization. Records in A and C are from two different neurons.
Figure 9.
Figure 9.
Temporal relationship between SWDs and associated cellular activities in the corticostriatal pathway. A, Examples of two successive EEG spike-wave complexes (top trace) and the corresponding intracellular activity in a CS neuron, an SON recorded with a KAc-filled electrode, an SON recorded with a KCl-filled electrode, and the extracellular activity of a striatal GABAergic interneuron (bottom traces). The interneuron and the SON recorded with the KAc-filled electrode were recorded in the same animal. B, Averaged latencies (mean ± SD) of all action potentials related to the EEG spike component used as the zero-time reference (A, dashed line). Because SONs recorded with KAc-filled electrodes were silent during SWDs, we used the time delays measured from the EEG and the intracellular waveforms (Fig. 5C). The number of computed neuron-EEG pairs is indicated in the figure.

Similar articles

Cited by

References

    1. Bruno RM, Khatri V, Land PW, Simons DJ (2003) Thalamocortical angular tuning domains within individual barrels of rat somatosensory cortex. J Neurosci 23: 9565-9574. - PMC - PubMed
    1. Chang HT, Wilson CJ, Kitai ST (1982) A Golgi study of rat neostriatal neurons: light microscopic analysis. J Comp Neurol 208: 107-126. - PubMed
    1. Charpier S, Lereshe N, Deniau J-M, Mahon S, Hughes SW, Crunelli V (1999) On the putative contribution of GABAB receptors to the electrical events occurring during spontaneous spike and waves discharges. Neuropharmacology 38: 1699-1706. - PubMed
    1. Connors BW, Gutnick MJ (1990) Intrinsic firing patterns of diverse neocortical neurons. Trends Neurosci 13: 99-104. - PubMed
    1. Cowan RL, Wilson CJ (1994) Spontaneous firing patterns and axonal projections of single corticostriatal neurons in the rat medial agranular cortex. J Neurophysiol 71: 17-32. - PubMed

Publication types

LinkOut - more resources