. 2004 Jul 28;24(30):6833-41.
doi: 10.1523/JNEUROSCI.1694-04.2004.

Regulation of an Aplysia bag-cell neuron cation channel by closely associated protein kinase A and a protein phosphatase

Affiliations

Regulation of an Aplysia bag-cell neuron cation channel by closely associated protein kinase A and a protein phosphatase

Neil S Magoski. J Neurosci. .

Abstract

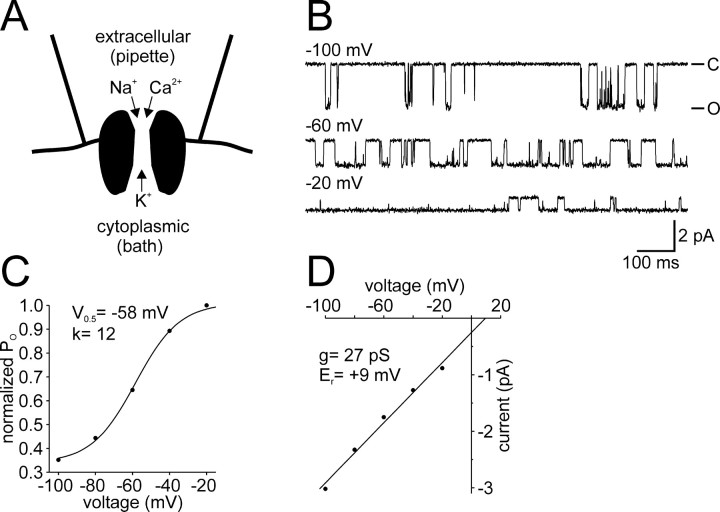
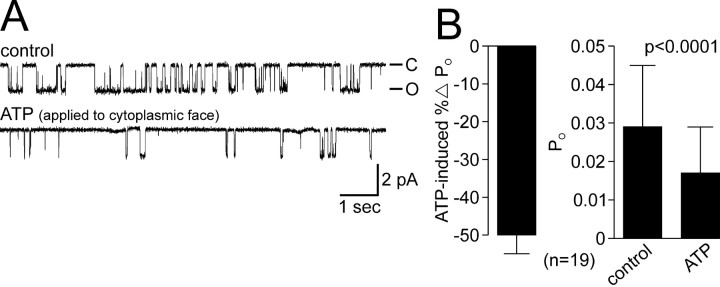
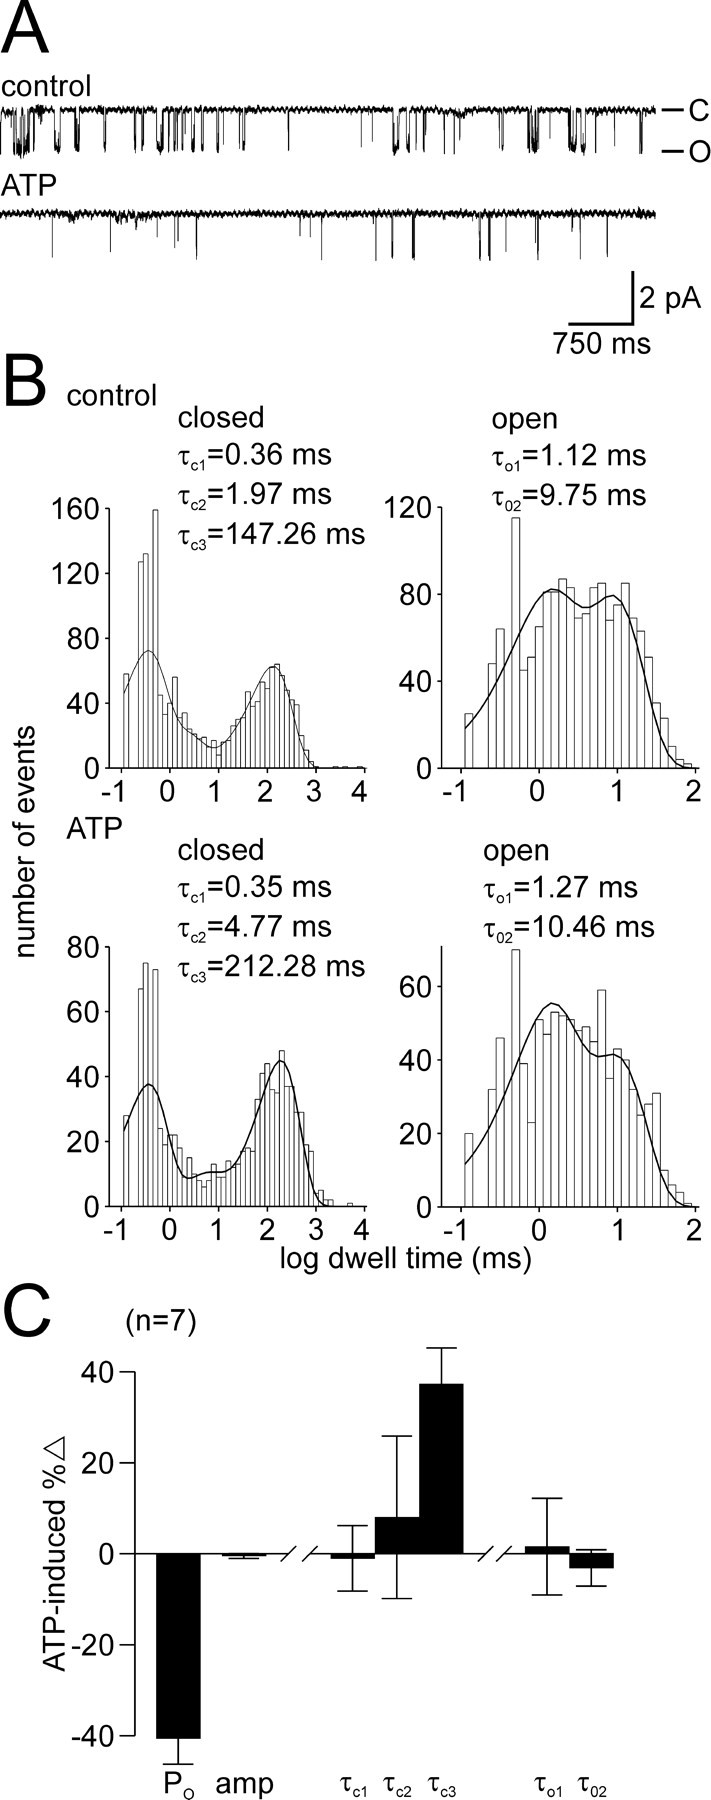
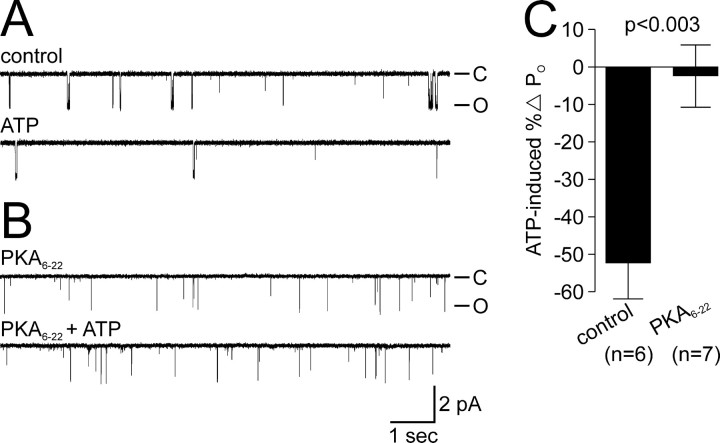
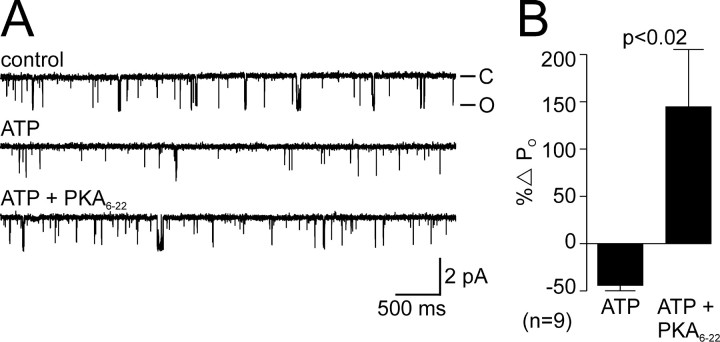
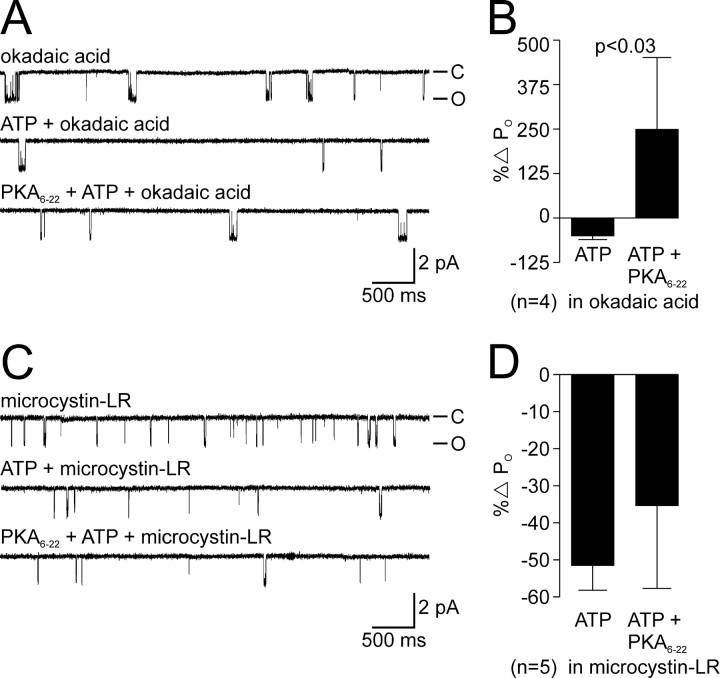
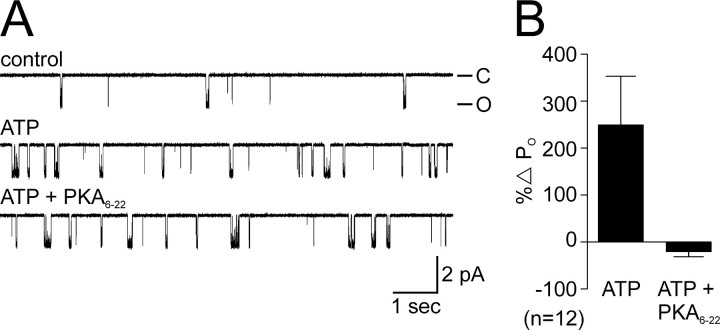
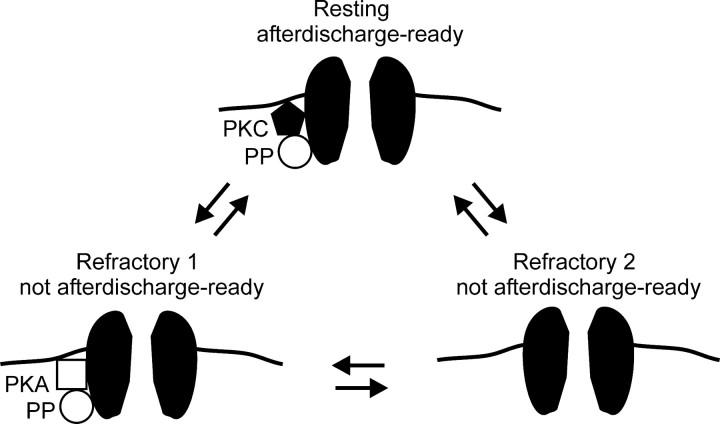
Ion channel regulation by closely associated kinases or phosphatases has emerged as a key mechanism for orchestrating neuromodulation. An exemplary case is the nonselective cation channel that drives the afterdischarge in Aplysia bag cell neurons. Initial studies showed that this channel is modulated by both a closely associated PKC and a serine/threonine protein phosphatase (PP). In excised, inside-out patches, the addition of ATP (a phosphate source) increases open probability (P(O)) through PKC, and this is reversed by the PP. Previous work also reported that, in certain cases, ATP can decrease cation channel P(O). The present study characterizes and provides a mechanism for this decreased P(O) ATP response. The kinetic change for channels inhibited by ATP was identical to the previously reported effect of exogenously applied protein kinase A (PKA) (i.e., a lengthening of the third closed-state time constant). The decreased P(O) ATP response was blocked by the PKA inhibitor peptide PKA(6-22), and its reversal was prevented by the PP inhibitor microcystin-LR. Furthermore, PKA(6-22) did not alter the increased P(O) ATP response. This suggests that both PKA and a PP are closely associated with these cation channels, but PKA and PKC are not simultaneously targeted. After an afterdischarge, the bag cell neurons are refractory and fail to respond to subsequent stimulation. The association of PKA with the cation channel may contribute to this decrease in excitability. Altering the constituents of a regulatory complex, such as exchanging PKA for PKC, may represent a general mechanism to precisely control ion channel function and excitability.


Figures

Figure 1.
Figure 1.
A cation channel in excised, inside-out patches. A, Diagrammatic representation of the bag cell neuron cation channel in an excised, inside-out patch (based on Wilson et al., 1996, 1998; Magoski et al., 2002). For the purposes of this study, the recording configuration is such that the extracellular face is within a pipette filled with nASW, whereas the cytoplasmic face is in a bath (tissue culture dish) containing artificial intracellular saline. Under these approximate physiological conditions, the channel is permeable to Na+, K+, and Ca2+ ions. B, Cation channel activity in an excised, inside-out patch at different steady-state holding potentials. Top trace, At -100 mV, the cation channel is seen as brief, unitary, inward current deflections of ∼3 pA. The closed state is at the top of the trace and designated by -C, whereas the open state is at the bottom and designated by -O. Middle trace, At -60 mV, the channel opens and closes repeatedly. Bottom trace, At -20 mV, the channel is open much of the time. Note that at all holding potentials, the single-channel current shows no voltage-dependent inactivation. C, Normalized PO versus voltage curve for the channel shown in B. PO was calculated over the entire time (usually 1-3 min; see Materials and Methods) at the given holding potentials (-100, -60, -20 as well as -80 and -40). PO was normalized by dividing by the PO at -20 mV, plotted against voltage, and the points fit with a Boltzmann function. The Boltzmann provides half-maximal voltage (V0.5) of activation and the slope factor (k) (i.e., the change in voltage required to move the PO e-fold). D, Channel current versus voltage relationship for the channel shown in B. Channel current amplitude at a particular voltage was derived from Gaussian fits of all-points histograms (see Materials and Methods). This was plotted against patch-holding potential and fit with linear regression to determine single-channel conductance (g) and, based on the X-intercept, the predicted reversal potential (Er).
Figure 2.
Figure 2.
Inhibition of the cation channel by ATP. A, ATP inhibits the cation channel. Top trace, Control recording of a cation channel in an excised, inside-out patch. Bottom trace, Applying 1 mm ATP to the cytoplasmic face of the patch initiates a maintained drop in PO. The patch was held at -60 mV. B, Summary of ATP-induced decrease in PO. Left graph, In 19 cation channel-containing patches used as initial tests or parallel controls, application of 1 mm ATP causes an ∼50% decrease in PO. Right graph, ATP produces a statistically significant decrease in PO from a control mean of -0.029 to a mean in ATP of -0.017 (p < 0.001; Wilcoxon matched-pairs test).
Figure 3.
Figure 3.
Kinetic analysis of the decreased PO ATP response. A, ATP inhibits a single cation channel. Top trace, Control recording of a true, single cation channel in an excised, inside-out patch. Bottom trace, Exposure of the cytoplasmic face of the patch to 1 mm ATP results in a decrease in PO. The patch was held at -60 mV. B, Single channel closed and open dwell times are plotted as histograms along with a fit of a sum of exponentials (see Materials and Methods). The time constants for the exponential fits are given in the inset of each graph. During the control period (top graphs), channel closed times are best fit by three exponentials (tC1, tC2, and tC3), and the open times by two exponentials (tO1 and tO2). When ATP is added (bottom graphs), the tC1 or tC2 change only slightly, whereas tC3 is obviously larger (an over 40% increase from ∼150 to ∼215 msec). For the open times in ATP, neither tO1 nor tO2 show any overt change. C, Summary data for the decreased PO ATP response of true, single-cation channels. For these seven channels/patches, ATP reduces PO by ∼40% with no change in channel current amplitude (amp). On average, although there is no real change in the first two closed-state time constants (tC1 and tC2), the third (tC3) shows an ∼40% increase with ATP. For the open-state time constants (tO1 and tO2), there is no net change with ATP.
Figure 4.
Figure 4.
The decreased PO ATP response is blocked by pretreatment with PKA6-22. A, A parallel control decreased PO ATP response. Top trace, A control cation channel recorded in an excised, inside-out patch. Bottom trace, Addition of 1 mm ATP to the cytoplasmic face of the patch produces a decrease in PO. The patch was held at -60 mV. B, The presence of PKA6-22 prevents the decreased PO ATP response. Top trace, Recording of a cation channel with 1 μm PKA6-22 bathing the cytoplasmic face of the patch. Bottom trace, Introduction of 1 mm ATP along with PKA6-22 does not result in a PO change. The patch was held at -60 mV. C, Summary data for the effect of ATP on cation channels in the absence or presence PKA6-22. Under control conditions, ATP elicits an ∼50% decrease in PO (n = 6 patches), whereas in the presence of PKA6-22, the mean change is just below 0% (n = 7 patches; p < 0.003; unpaired Student's t test).
Figure 5.
Figure 5.
The decreased PO ATP response is reversed by subsequent application of PKA6-22. A, Reversal of the decreased PO ATP response by PKA6-22. Top trace, A cation channel recorded in the excised, inside-out configuration. Middle trace, ATP (1 mm) applied to the cytoplasmic face of the patch decreases PO. Bottom trace, Addition of 1 μm PKA6-22 in the maintained presence of ATP results in restoration of PO back to that of control. The patch was held at -60 mV. B, Summary data for the effect of introducing PKA6-22 after ATP inhibits cation channels. In this group, ATP produces an ∼45% decrease in PO, but with the addition of PKA6-22, there is an ∼150% increase in PO as activity returns to control levels (n = 9 patches; p < 0.02; paired Student's t test).
Figure 6.
Figure 6.
Reversal of the decreased PO ATP response by PKA6-22 is prevented by microcystin-LR but not okadaic acid. A, Pretreatment with okadaic acid does not alter the ability of PKA6-22 to reverse the decreased PO ATP response. Top trace, A recording of a cation channel in an excised, inside-out patch with the cytoplasmic face bathed by 100 nm okadaic acid. Middle trace, Application of 1 mm ATP initiates a decrease in PO. Bottom trace, Introduction of 1 μm PKA6-22, in the combined presence of ATP and okadaic acid, initiates a return of PO toward control levels. The patch was held at -60 mV. B, Summary data for the lack of an effect of okadaic acid on PKA6-22-mediated reversal of the decreased PO ATP response. The application of ATP in the presence of okadaic acid decreases PO by ∼50%, and after introduction of PKA6-22, channel activity returns to pre-ATP levels with a near 250% increase in PO (n = 4 patches; p < 0.03; Wilcoxon matched-pairs test). C, Pretreatment with microcystin-LR prevents reversal of the decreased PO ATP response by PKA6-22. Top trace, Excised, inside-out patch recording of a cation channel with the cytoplasmic face bathed by 200 nm microcystin-LR. Middle trace, Delivery of 1 mm ATP results in a PO decrease. Bottom trace, When 1 μm PKA6-22 is applied along with ATP and microcystin-LR, there is no reversal of activity, and PO remains lowered. The patch was held at -60 mV. D, Summary data for the effect of microcystin-LR on PKA6-22-mediated reversal of the decreased PO ATP response. While in the presence of microcystin-LR, the addition of ATP causes a slightly >50% decrease in PO. This drop in activity is not reversed with the subsequent application of PKA6-22, and, in fact, the PO drops even further by ∼35% (n = 5 patches).
Figure 7.
Figure 7.
The increased PO ATP response is not augmented by PKA6-22. A, PKA6-22 does not alter the magnitude of the increased PO ATP response. Top trace, An excised, inside-out patch recording of a cation channel. Middle trace, Application of 1 mm ATP to the cytoplasmic face produces a robust PO increase. Bottom trace, The PO remains unchanged after the addition of 1 μm PKA6-22. The patch was held at -60 mV. B, Summary data for the lack of an effect of PKA6-22 on the increased PO ATP response. This set of responsive channels shows an ∼250% elevation in PO with the addition of ATP. The enhancement is not altered further when PKA6-22 is added, because the PO shows only an ∼20% drop that is not significantly different from zero (n = 12 patches; p > 0.05; one-sample t test).
Figure 8.
Figure 8.
Model for altering the constituents of the cation channel regulatory complex under different states of excitability. Top, At rest, when the bag cell neurons are ready to afterdischarge, the regulatory complex consists of a closely associated, stimulatory PKC along with a counterbalancing PP. This would represent channels that display the increased PO ATP response. Bottom left, After an afterdischarge, the bag cell neurons become refractory and, despite additional stimulation, are unable to afterdischarge further. This first refractory scenario has an inhibitory PKA, as well as a counterbalancing PP, associated with the cation channel. The down-regulation of cation channel activity by PKA may contribute to the inexcitability seen during refractoriness. Bottom right, A second refractory scenario has a cation channel that lacks a regulatory complex altogether. Arrows indicate the possibility of transition between different states of the complex by altering the component enzymes.

Similar articles

Cited by

References

    1. Adams WB, Levitan IB (1982) Intracellular injection of protein kinase inhibitor blocks the serotonin-induced increase in K+ conductance in Aplysia neuron R15. Proc Natl Acad Sci USA 79: 3877-3880. - PMC - PubMed
    1. Alonso A, Llinas RR (1989) Subthreshold Na+-dependent theta-like rhythmicity in stellate cells of entorhinal cortex layer II. Nature 342: 175-177. - PubMed
    1. Ashby CD, Walsh DA (1972) Characterization of the interaction of a protein inhibitor with adenosine 3′,5′-monophosphate-dependent protein kinases. J Biol Chem 247: 6637-6642. - PubMed
    1. Beurrier C, Congar P, Bioulac B, Hammond C (1999) Subthalamic nucleus neurons switch from single-spike activity to burst firing mode. J Neurosci 19: 599-609. - PMC - PubMed
    1. Bialojan C, Takai A (1988) Inhibitory effect of a marine-sponge toxin, okadaic acid, on protein phosphatases. Specificity and kinetics. Biochem J 256: 283-290. - PMC - PubMed

Publication types

MeSH terms

Grants and funding

LinkOut - more resources