

Loss of the Sall3 gene leads to palate deficiency, abnormalities in cranial nerves, and perinatal lethality
- PMID: 15282310
- PMCID: PMC479739
- DOI: 10.1128/MCB.24.16.7102-7112.2004
Loss of the Sall3 gene leads to palate deficiency, abnormalities in cranial nerves, and perinatal lethality
Abstract
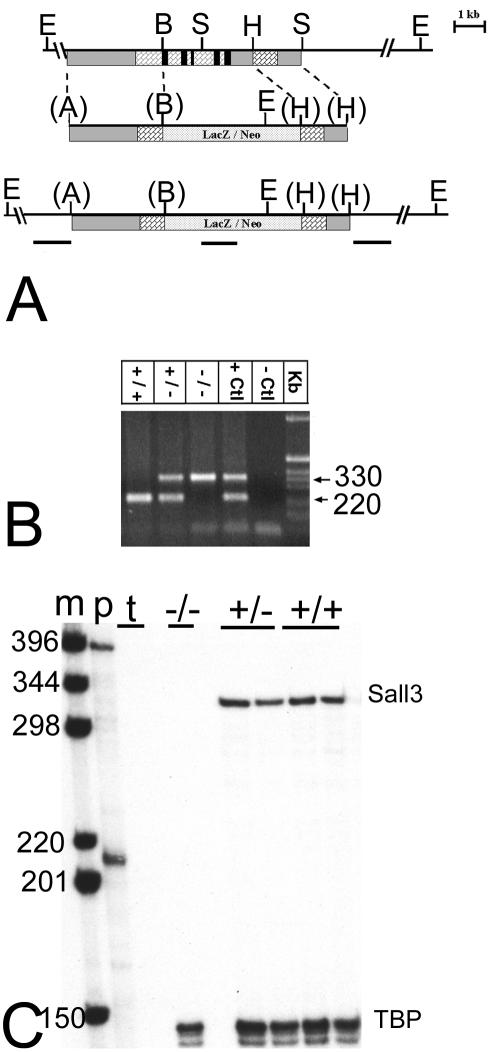
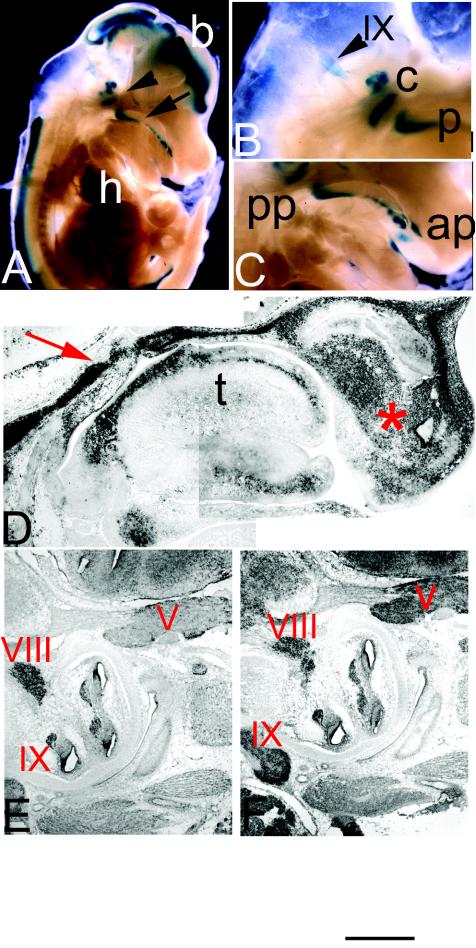
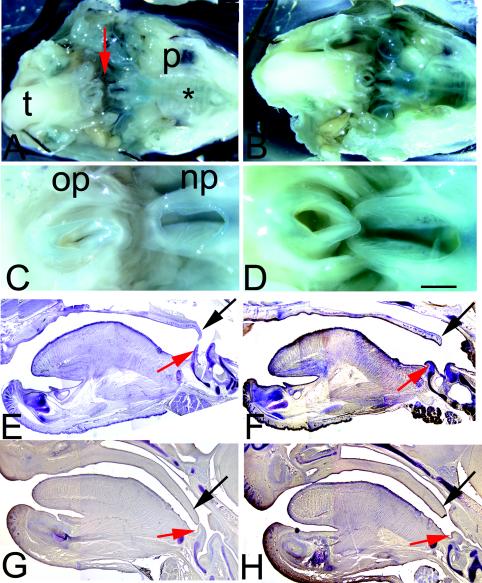
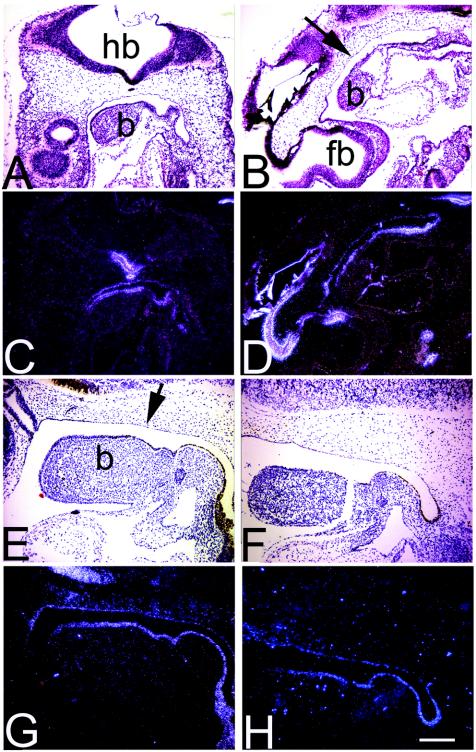
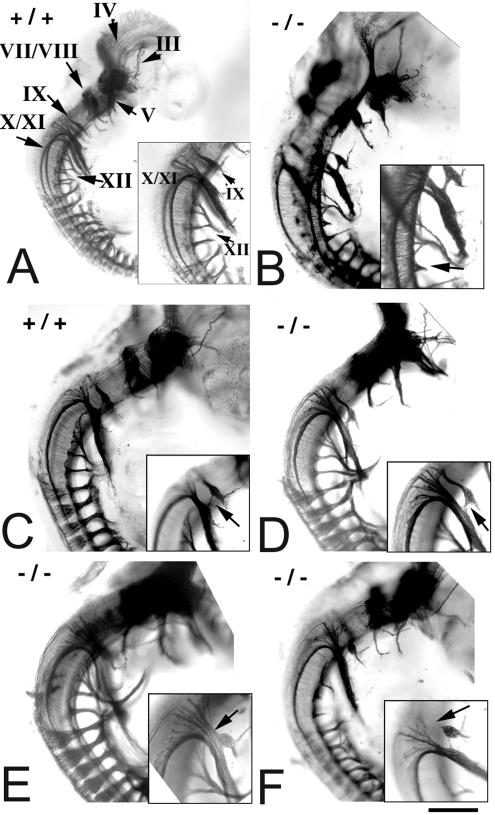
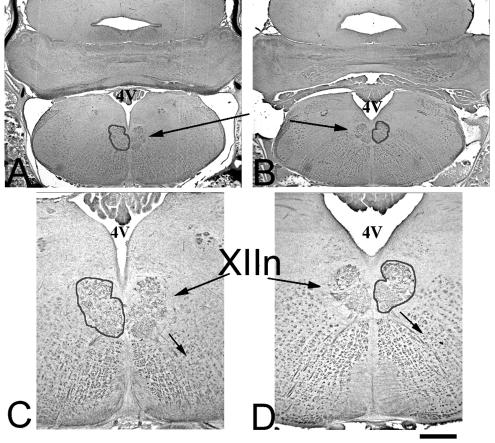
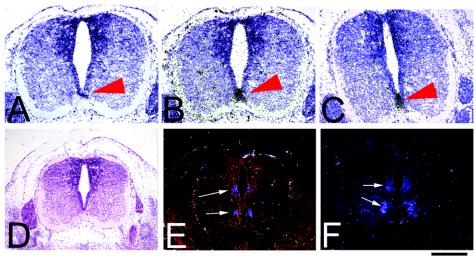
Members of the Spalt gene family encode putative transcription factors characterized by seven to nine C2H2 zinc finger motifs. Four genes have been identified in mice--Spalt1 to Spalt4 (Sall1 to Sall4). Spalt homologues are widely expressed in neural and mesodermal tissues during early embryogenesis. Sall3 is normally expressed in mice from embryonic day 7 (E7) in the neural ectoderm and primitive streak and subsequently in the brain, peripheral nerves, spinal cord, limb buds, palate, heart, and otic vesicles. We have generated a targeted disruption of Sall3 in mice. Homozygous mutant animals die on the first postnatal day and fail to feed. Examination of the oral structures of these animals revealed that abnormalities were present in the palate and epiglottis from E16.5. In E10.5 embryos, deficiencies in cranial nerves that normally innervate oral structures, particularly the glossopharyngeal nerve (IX), were observed. These studies indicate that Sall3 is required for the development of nerves that are derived from the hindbrain and for the formation of adjacent branchial arch derivatives.
Figures
Similar articles
-
Hoxa1 and Hoxb1 synergize in patterning the hindbrain, cranial nerves and second pharyngeal arch.Development. 1998 Mar;125(6):1123-36. doi: 10.1242/dev.125.6.1123. Development. 1998. PMID: 9463359
-
Targeted disruption of the homeobox gene Nkx2.9 reveals a role in development of the spinal accessory nerve.Development. 2003 Mar;130(6):1193-202. doi: 10.1242/dev.00346. Development. 2003. PMID: 12571110
-
The regional pattern of retinoic acid synthesis by RALDH2 is essential for the development of posterior pharyngeal arches and the enteric nervous system.Development. 2003 Jun;130(11):2525-34. doi: 10.1242/dev.00463. Development. 2003. PMID: 12702665
-
Defective neural tube closure and anteroposterior patterning in mice lacking the LIM protein LMO4 or its interacting partner Deaf-1.Mol Cell Biol. 2004 Mar;24(5):2074-82. doi: 10.1128/MCB.24.5.2074-2082.2004. Mol Cell Biol. 2004. PMID: 14966286 Free PMC article.
-
The role of foxi family transcription factors in the development of the ear and jaw.Curr Top Dev Biol. 2015;111:461-95. doi: 10.1016/bs.ctdb.2014.11.014. Epub 2015 Jan 21. Curr Top Dev Biol. 2015. PMID: 25662269 Free PMC article. Review.
Cited by
-
Analysis of FGF20-regulated genes in organ of Corti progenitors by translating ribosome affinity purification.Dev Dyn. 2020 Oct;249(10):1217-1242. doi: 10.1002/dvdy.211. Epub 2020 Jul 10. Dev Dyn. 2020. PMID: 32492250 Free PMC article.
-
SALL3 expression balance underlies lineage biases in human induced pluripotent stem cell differentiation.Nat Commun. 2019 May 15;10(1):2175. doi: 10.1038/s41467-019-09511-4. Nat Commun. 2019. PMID: 31092818 Free PMC article.
-
SALL Proteins; Common and Antagonistic Roles in Cancer.Cancers (Basel). 2021 Dec 15;13(24):6292. doi: 10.3390/cancers13246292. Cancers (Basel). 2021. PMID: 34944911 Free PMC article. Review.
-
Aberrant methylation and downregulation of sall3 in human hepatocellular carcinoma.World J Gastroenterol. 2012 Jun 7;18(21):2719-26. doi: 10.3748/wjg.v18.i21.2719. World J Gastroenterol. 2012. PMID: 22690083 Free PMC article.
-
Spalt mediates an evolutionarily conserved switch to fibrillar muscle fate in insects.Nature. 2011 Nov 16;479(7373):406-9. doi: 10.1038/nature10559. Nature. 2011. PMID: 22094701
References
-
- Al-Baradie, R., K. Yamada, C. St Hilaire, W. M. Chan, C. Andrews, N. McIntosh, M. Nakano, E. J. Martonyi, W. R. Raymond, S. Okumura, M. M. Okihiro, and E. C. Engle. 2002. Duane radial ray syndrome (Okihiro syndrome) maps to 20q13 and results from mutations in SALL4, a new member of the SAL family. Am. J. Hum. Genet. 71:1195-1199. - PMC - PubMed
-
- Barrio, R., M. J. Shea, J. Carulli, K. Lipkow, U. Gaul, G. Frommer, R. Schuh, H. Jäckle, and F. C. Kafatos. 1996. The spalt-related gene of Drosophila melanogaster is a member of an ancient gene family, defined by the adjacent, region-specific homeotic gene spalt. Dev. Genes Evol. 206:315-325. - PubMed
-
- Basson, M., and H. R. Horvitz. 1996. The Caenorhabditis elegans gene sem-4 controls neuronal and mesodermal cell development and encodes a zinc finger protein. Genes Dev. 10:1953-1965. - PubMed
-
- Bose, J., L. Grotewold, and U. Ruther. 2002. Pallister-Hall syndrome phenotype in mice mutant for Gli3. Hum. Mol. Genet. 11:1129-1135. - PubMed
-
- Buck, A., L. Archangelo, C. Dixkens, and J. Kohlhase. 2000. Molecular cloning, chromosomal localization, and expression of the murine SALL1 ortholog Sall1. Cytogenet. Cell Genet. 89:150-153. - PubMed
Publication types
MeSH terms
Substances
Grants and funding
LinkOut - more resources
Full Text Sources
Medical
Molecular Biology Databases