. 2004 Aug;24(16):7214-24.
doi: 10.1128/MCB.24.16.7214-7224.2004.

Vanin-1-/- mice exhibit a glutathione-mediated tissue resistance to oxidative stress

Affiliations

Vanin-1-/- mice exhibit a glutathione-mediated tissue resistance to oxidative stress

C Berruyer et al. Mol Cell Biol. 2004 Aug.

Abstract

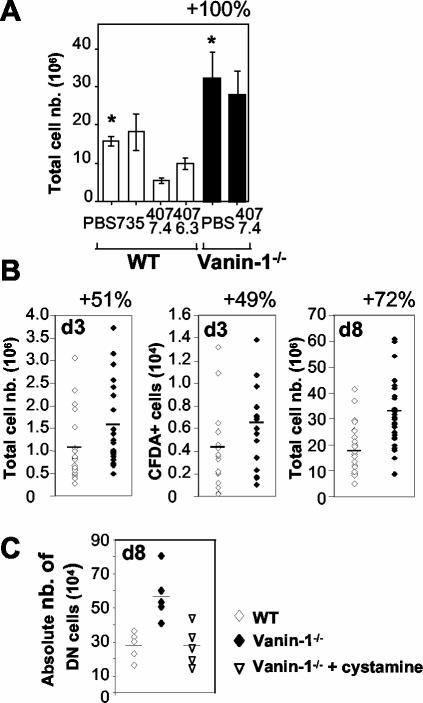
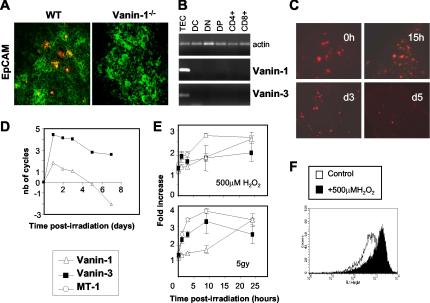
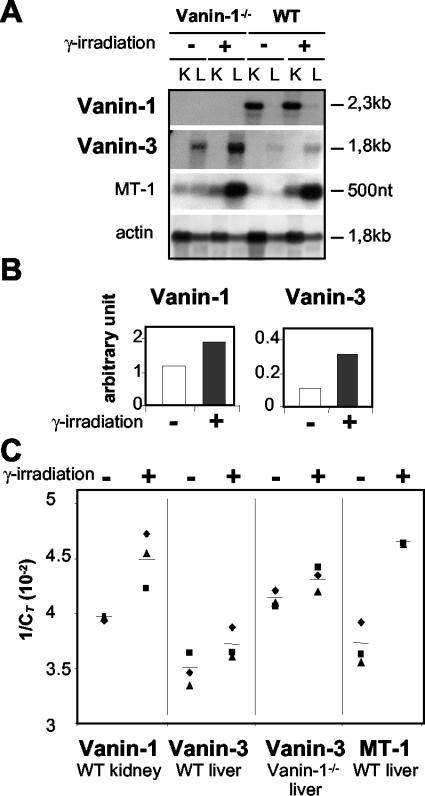
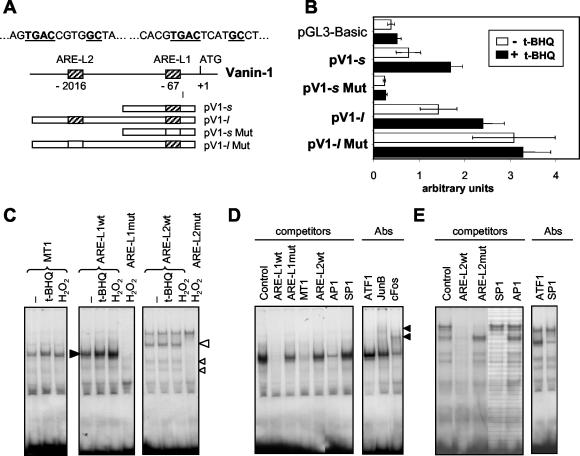
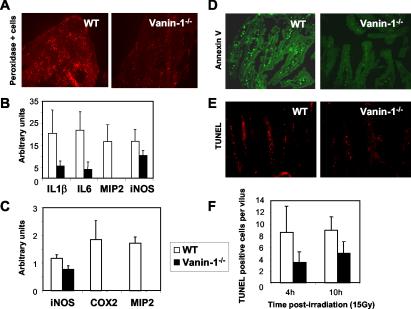
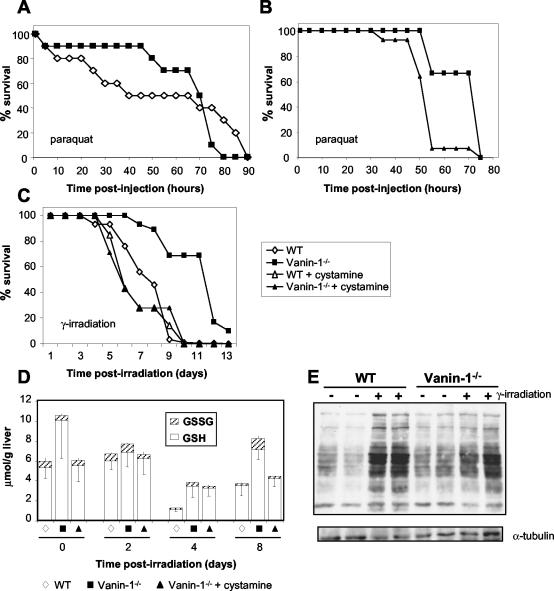
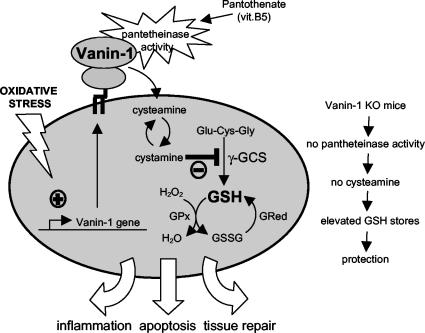
Vanin-1 is an epithelial ectoenzyme with pantetheinase activity and generating the amino-thiol cysteamine through the metabolism of pantothenic acid (vitamin B(5)). Here we show that Vanin-1(-/-) mice, which lack cysteamine in tissues, exhibit resistance to oxidative injury induced by whole-body gamma-irradiation or paraquat. This protection is correlated with reduced apoptosis and inflammation and is reversed by treating mutant animals with cystamine. The better tolerance of the Vanin-1(-/-) mice is associated with an enhanced gamma-glutamylcysteine synthetase activity in liver, probably due to the absence of cysteamine and leading to elevated stores of glutathione (GSH), the most potent cellular antioxidant. Consequently, Vanin-1(-/-) mice maintain a more reducing environment in tissue after exposure to irradiation. In normal mice, we found a stress-induced biphasic expression of Vanin-1 regulated via antioxidant response elements in its promoter region. This process should finely tune the redox environment and thus change an early inflammatory process into a late tissue repair process. We propose Vanin-1 as a key molecule to regulate the GSH-dependent response to oxidative injury in tissue at the epithelial level. Therefore, Vanin/pantetheinase inhibitors could be useful for treatment of damage due to irradiation and pro-oxidant inducers.


Figures

FIG. 1.
FIG. 1.
Improved regeneration of irradiated thymus in Vanin-1−/− mice. Thymic reconstitution in whole-body-irradiated mice (6 Gy) was estimated by the total cell count. (A) Anti-Vanin-1 (407-7-4 and 407-6-3) or isotype-matched control (735) antibodies (50 μg) were injected intravenously into WT or Vanin-1−/− mice (n = 5). PBS was used as a control. White bars show WT mice, and black bars show Vanin-1−/− mice. *, P < 0.001. (B) Thymic cellularity in WT and Vanin-1−/− mice on day 3 (d3; n = 22 and 24, respectively; P < 0.02) or day 8 (d8; n = 29 and 31, respectively; P < 0.0001) postirradiation. Where indicated, some irradiated mice received 3 × 10⁷ CFDA-SE-labeled bone marrow cells intravenously, and intrathymic fluorescence-positive cells were counted by cytofluorimetry on day 3 (n = 15 and 17, respectively; P < 0.05). (C) Counting of the immature DN CD4 CD8 T cells in thymus 8 days after irradiation. For statistical analysis, P < 0.005 comparing WT with Vanin-1−/− mice and nontreated with treated Vanin-1−/− mice. Each point is representative of an animal.
FIG. 2.
FIG. 2.
Vanin gene expression in the thymus is restricted to the EpCAM+ epithelial cells and regulated following irradiation. (A) Double staining of thymic sections from WT and Vanin-1−/− mice, using the anti-Vanin-1 407 MAb, revealed by tyramide staining (red) and the FITC-coupled EpCAM MAb (green). (B) RT-PCR analysis of the distribution of the Vanin-1 and Vanin-3 transcripts in thymic sorted cell populations. (C) Kinetic analysis of Vanin-1 expression in irradiated thymuses by immunohistology using MAb 407 revealed by tyramide staining (red). (D) Real-time RT-PCR determination of the Vanin-1 and Vanin-3 transcripts in the thymus postirradiation. Values represent the difference in the number of cycles between each time point and the physiological conditions fixed to 0 (a variation of one cycle was equivalent to a two-fold increase in gene expression). (E) RNA dot blot results showing up-regulation of the Vanin-1 and Vanin-3 mRNAs in cultured TECs subjected to 500 μM H2O2 or 5 Gy of γ-irradiation. Expression of the MT-1 gene was monitored as a stress-inducible positive control. Data represent the combined result of three independent experiments. (F) Flow cytometric detection of the cell surface expression of the Vanin-1 protein (MAb 407) by TECs with or without incubated with 500 μM H2O2 for 12 h.
FIG. 3.
FIG. 3.
In vivo up-regulation of Vanin gene expression following whole-body irradiation. (A and B) Analysis of Vanin-1 and Vanin-3 expression in kidney (K) or liver (L) from WT or Vanin-1−/− mice subjected to γ-irradiation (6 Gy) or not irradiated. MT-1 and actin were assayed simultaneously as postive and negative controls, respectively. Studies were performed by Northern blot analysis 9 h postirradiation (A), and results were quantified using the TINAbas reader and phosphorimager (FUJI BAS 1000) (B). (C) Real-time RT-PCR was used and values are shown as 1/CT, where CT represents the threshold cycle. A high CT value corresponds to a small amount of template DNA, and a low CT value corresponds to a large amount of template present initially (18). Each point represents independent experiments with on different animals.
FIG. 4.
FIG. 4.
Involvement of AREs in the stress-induced modulation of Vanin-1 expression. (A) Diagram of the 5′-flanking region of the Vanin-1 gene (arbitrary scale), together with the different pGL3-Basic luciferase reporter constructs containing one or two normal (hatched boxes) or mutated (white boxes) ARE-like elements. (B) Luciferase reporter gene assays were performed with TECs transiently transfected (48 h) with the pGL3-Basic vector control or various Vanin-1 promoter constructs and subjected to 50 μM t-BHQ for 12 h or left untreated. (C to E) Characterization of the factors binding to ARE-L1 and ARE-L2 sequences. 32P-labeled WT or mutated (Mut) ARE-L1 and ARE-L2 probes or a MT-1 promoter-derived ARE probe were incubated with nuclear extracts (5 μg) prepared from unstimulated (−), t-BHQ-stimulated (1 h, 50 μM), or H2O2-stimulated (1 h, 500 μM) TECs. The position of the major complexes observed with the WT ARE-L1 and ARE-L2 probes are indicated by solid and open arrowheads, respectively. Competition studies showed in panels D and E for ARE-L1 and ARE-L2, respectively, were carried out by adding a 100-fold excess of an unlabeled WT or Mut ARE-L1, WT ARE-L2, MT-1, AP-1, or SP-1 oligonucleotide to the nuclear extract from H2O2-treated cells. When indicated, the binding-reaction mixture also contained a specific antibody directed against ATF1, cFos, Jun B, or SP-1 protein, and arrows identify specific retarded complexes.
FIG. 5.
FIG. 5.
Moderate inflammation and reduced apoptosis in tissues of Vanin-1−/− mice following irradiation. (A) Tyramide staining reveal the endogenous peroxidase activity was done on thymic cryosections from WT and Vanin-1−/− mice 24 h postirradiation (6 Gy). (B and C) Quantification of the RT-PCR detection of transcripts encoding proinflammatory markers in WT and Vanin-1−/− thymus (B) or ileum (C) 24 h postirradiation (6 Gy). This analysis was performed with three animals for each condition. Only results with P < 0.05 are shown. (D and E) Histological revealation of FITC-labeled annexin V-positive (green) or TUNEL-positive (red) apoptotic cells within the ileum 10 h after irradiation (10 Gy). (F) Quantification of TUNEL-positive cells per villus observed postirradiation (10 Gy). Samples were removed at 4 h (WT n = 10, Vanin-1−/− n = 5; P < 0.03) and 10 h (WT n = 4, Vanin-1−/− n = 3; P < 0.04).
FIG. 6.
FIG. 6.
Vanin-1−/− mice display resistance to systemic oxidative stress caused by paraquat administration or a lethal dose of γ-irradiation. (A and B) Mice were subjected to intraperitoneal administration of paraquat (70 μg/g of body weight). Comparison of the survival between WT and Vanin-1−/− mice (n = 10) (A) and comparison of the survival between nontreated (n = 9) and cysteamine-treated (n = 14) Vanin-1−/− mice in an independent experiment (B) are shown. Intraperitoneal injections of cystamine were done daily (120 mg/kg of body weight). (C) Cohorts of WT (n = 30), Vanin-1−/− (n = 29), and cysteamine-treated Vanin-1−/− (n = 7) female mice were exposed to 10 Gy of γ-irradiation. Survival was plotted in as a percentage of the total. (D) Kinetic analysis of the GSH and GSSG levels in the livers of irradiated mice (10 Gy). Data are expressed in micromoles per gram of liver, and measurements were made on five or six mice. Importantly, for days 4 and 8 postirradiation, values correspond to dosages used on surviving animals. (E) Comparison of oxidized protein levels among liver lysates from WT or Vanin-1−/− mice under normal or postirradiation (4 days, 10 Gy) conditions by detection of protein carbonyl groups (OxyBlot; Oxis). Secondary blotting using antiserum against α-tubulin was performed to verify protein loading (bottom panel). Results are presented for two animals for each condition; this was repeated with two others, giving the same results.
FIG. 7.
FIG. 7.
Vanin-1 as a sensor of oxidative stress. The Vanin-1 gene is regulated on stress induction, and the pantetheinase activity of the cell surface molecule provides tissue with cysteamine through the metabolism of pantothenate (vitamin B5). One major effect is the γGCS-mediated regulation of the endogenous GSH pool, influencing the redox status and therefore the cell fate in response to oxidative stress injury.

Similar articles

Cited by

References

    1. Andrews, G. K. 2000. Regulation of metallothionein gene expression by oxidative stress and metal ions. Biochem. Pharmacol. 59:95-104. - PubMed
    1. Arudchelvan, Y., N. Tokuda, M. Tamechika, Y. H. Wang, N. Mizutani, T. Sawada, K. Yamaguchi, T. Fukumoto, and F. Shinozaki. 2000. Semiquantitative morphological analysis of stromal cells in the irradiated and recovering rat thymus. Arch. Histol. Cytol. 63:147-157. - PubMed
    1. Aurrand-Lions, M., F. Galland, H. Bazin, V. Zakharyev, B. A. Imhof, and P. Naquet. 1996. Vanin-1, a novel GPI-linked perivascular molecule involved in thymus homing. Immunity 5:391-405. - PubMed
    1. Chanas, S. A., Q. Jiang, M. McMahon, G. K. McWalter, L. I. McLellan, C. R. Elcombe, C. J. Henderson, C. R. Wolf, G. J. Moffat, K. Itoh, M. Yamamoto, and J. D. Hayes. 2002. Loss of the Nrf2 transcription factor causes a marked reduction in constitutive and inducible expression of the glutathione S-transferase Gsta1, Gsta2, Gstm1, Gstm2, Gstm3 and Gstm4 genes in the livers of male and female mice. Biochem. J. 365:405-416. - PMC - PubMed
    1. Chen, W., M. E. Frank, W. Jin, and S. M. Wahl. 2001. TGF-beta released by apoptotic T cells contributes to an immunosuppressive milieu. Immunity 14:715-725. - PubMed

Publication types

MeSH terms