. 2004 Oct;15(10):4658-68.
doi: 10.1091/mbc.e04-02-0149. Epub 2004 Jul 28.

Visualization of regulated exocytosis with a granule-membrane probe using total internal reflection microscopy

Affiliations

Visualization of regulated exocytosis with a granule-membrane probe using total internal reflection microscopy

Miriam W Allersma et al. Mol Biol Cell. 2004 Oct.

Abstract

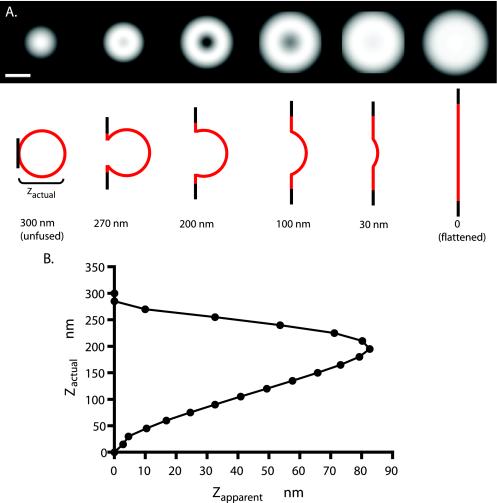
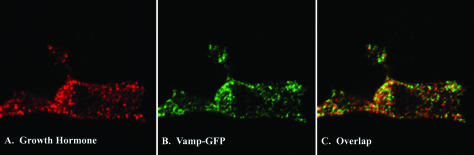
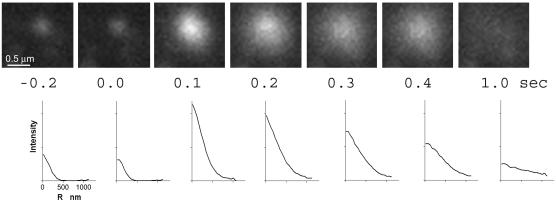
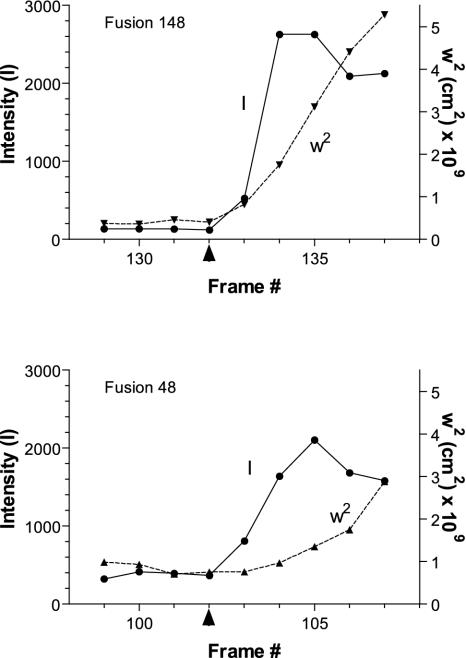
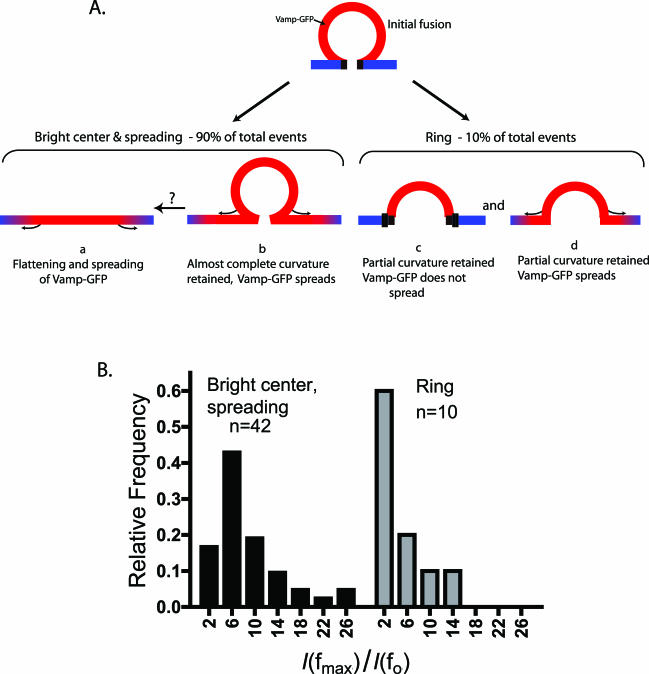
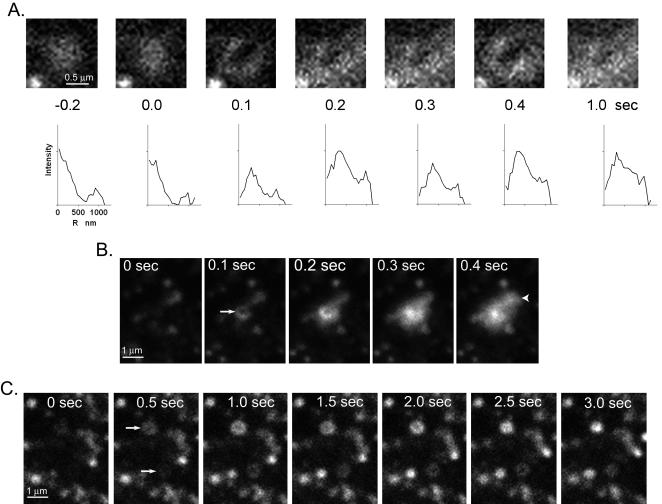
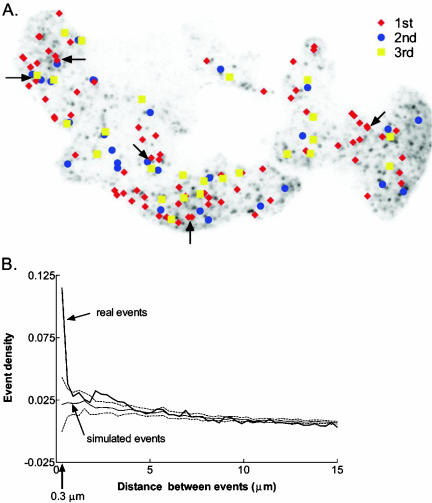
Secretory granules labeled with Vamp-green fluorescent protein (GFP) showed distinct signatures upon exocytosis when viewed by total internal reflection fluorescence microscopy. In approximately 90% of fusion events, we observed a large increase in fluorescence intensity coupled with a transition from a small punctate appearance to a larger, spreading cloud with free diffusion of the Vamp-GFP into the plasma membrane. Quantitation suggests that these events reflect the progression of an initially fused and spherical granule flattening into the plane of the plasma membrane as the Vamp-GFP simultaneously diffuses through the fusion junction. Approximately 10% of the events showed a transition from puncta to ring-like structures coupled with little or no spreading. The ring-like images correspond quantitatively to granules fusing and retaining concavity (recess of approximately 200 nm). A majority of fusion events involved granules that were present in the evanescent field for at least 12 s. However, approximately 20% of the events involved granules that were present in the evanescent field for no more than 0.3 s, indicating that the interaction of the granule with the plasma membrane that leads to exocytosis can occur within that time. In addition, approximately 10% of the exocytotic sites were much more likely to occur within a granule diameter of a previous event than can be accounted for by chance, suggestive of sequential (piggy-back) exocytosis that has been observed in other cells. Overall granule behavior before and during fusion is strikingly similar to exocytosis previously described in the constitutive secretory pathway.


Figures

Figure 6.
Figure 6.
Computed exocytotic images. The image patterns that might be expected with TIRFM optics for different profiles of a spherical granule fusing with a planar plasma membrane were computed (see Materials and Methods) assuming a 300-nm initial granule diameter, Vamp-GFP-evenly distributed in the granule membrane at all times, and an evanescent field decay constant of 55 nm. The truncated area flattens into a planar annulus with a central hole at the truncation and an outside radius that conserves the total surface area of the granule. The initial projection was convoluted with a point spread function that was derived theoretically and agrees with an experimentally derived estimate from 20-nm-diameter fluorescent beads. (A) The top images are the computed point spread function convoluted images of the exocytotic profiles schematically depicted below. Bar, 300 nm. (B) Relationship between the actual depth of the recessed granule membrane zactual and the apparent depth zapparent, determined by the ratio of the intensities of the dimmest pixel in the center and the brightest in the periphery. Note that for all values of zapparent except the largest, there are two values for zactual. Apparent depth zapparent is greatest when zactual is ∼200 nm.
Figure 1.
Figure 1.
Vamp-GFP colocalizes with chromaffin granules in chromaffin cells. Chromaffin cells were cotransfected with plasmids encoding hGH and Vamp-GFP. Four days later, cells were fixed, permeabilized, and the hGH detected with immunocytochemistry by using anti-hGH. Transfected cells were visualized by confocal microscopy. (A) hGH. (B) Vamp-GFP (GFP fluorescence). (C) overlap (yellow).
Figure 2.
Figure 2.
An intensity burst characterizes the fusion of an individual Vamp-GFP-labeled granule with the plasma membrane. Successive frames show the fusion of a Vamp-GFP–containing granule and the subsequent spread of the Vamp-GFP in the plasma membrane. The frame just before fusion is t = 0.0 s. Below each image is the Vamp-GFP intensity (with background subtracted) averaged as a function of radial distance (r) away from the granule center. Note that peak intensity is in the center of the intensity profile at all times. The fluorescence almost completely disappeared after 1 s.
Figure 3.
Figure 3.
Analysis of the total intensity and width of the fluorescence profile. The total intensity I of Vamp-GFP from individual granules and the width squared, w2, of the radially averaged Gaussian fit of the intensity profile in each frame before, during, and after fusion were determined. Two events are shown. In fusion 148, the total intensity and the w2 increased simultaneously. In fusion 48, the total intensity rose before w2 increased significantly. The arrowhead along the x-axis indicates the frame immediately preceding fusion. The frame rate was 10 Hz.
Figure 5.
Figure 5.
Different types of fusion events. (A) Schematic of possible configurations of a fused chromaffin granule. (B) The distribution of the ratios of maximal integrated intensity observed after fusion in some frame fmax, denoted as I(fmax), to the integrated intensity in the last frame f0 before fusion, denoted as I(f0). Distributions are presented for two distinct types of events, the bright center and spreading events observed in 90% of cases, and the ring structures observed 10% of cases. Note that relatively small increases in total intensity characterize the distribution of intensity ratios of ring structures. The populations are significantly different (p < 0.006, Mann-Whitney test).
Figure 4.
Figure 4.
Fusion events in which the center has a lower fluorescence than the surround. (A) Fusion occurred between 0 and 0.1 s. Below each image is the Vamp-GFP intensity (with background subtracted) averaged as a function of radial distance (r) away from the granule center. (B) A similar event to that in A occurred by 0.5 s (indicated by arrow) except that the center brighten at 0.3 s, consistent with the granule membrane flattening into the plane of the plasma membrane. Another fusion event occurs between 0.3 and 0.4 s (arrowhead) with bright center pixels. (C) Two fusion events occur between 0 and 0.5 s (arrows) with the centers of each dimmer than the surround. Both of these events were relatively long-lived (∼2 s). Note the different scales in B and C compared with A.
Figure 7.
Figure 7.
Spatial distribution of exocytotic events in a cell. The cell was stimulated three times for ∼5 s with the nicotinic agonist DMPP. There were 3- and 8-min intervals between stimulations. (A) Image of the cell with the locations of fusion events during successive stimulations. Arrows indicate several sites where multiple fusions occurred, either during the same or successive stimulations. (B) Frequency of events at different distances from each other. The distances from each event to all later events in that cell were calculated and then binned in 0.3-μm ranges. The number of events in each bin was divided by the area of the annulus, π(r22 – r12), to obtain an event density. Also plotted are the results from 1000 simulated experiments (± SD, dashed lines) of randomly generated events. The simulated cell had the same size and shape as the real cell. An exocytotic site was more likely to have another event occur within 0.3 μm (indicated by arrow on x-axis) than can be accounted for by chance.

Similar articles

Cited by

References

    1. Albillos, A., Dernick, G., Horstmann, H., Almers, W., Alvarez de Toledo, G., and Lindau, M. (1997). The exocytotic event in chromaffin cells revealed by patch amperometry. Nature 389, 509-512. - PubMed
    1. Ales, E., Tabares, L., Poyato, J.M., Valero, V., Lindau, M., and Alvarez de Toledo, G. (1999). High calcium concentrations shift the mode of exocytosis to the kiss-and-run mechanism.[comment]. Nat. Cell Biol. 1, 40-44. - PubMed
    1. Alvarez de Toledo, G., and Fernandez, J.M. (1990). Compound versus multigranular exocytosis in peritineal mast cells. J. Gen. Physiol. 95, 397-409. - PMC - PubMed
    1. Axelrod, D. (1981). Cell-substrate contacts illuminated by total internal reflection fluorescence. J. Cell Biol. 89, 141-145. - PMC - PubMed
    1. Axelrod, D. (2001). Selective imaging of surface fluorescence with very high aperture microscope objectives. J. Biomed. Optics 6, 6-13. - PubMed

Publication types

MeSH terms

LinkOut - more resources