

Noncompetitive allosteric inhibitors of the inflammatory chemokine receptors CXCR1 and CXCR2: prevention of reperfusion injury
- PMID: 15282370
- PMCID: PMC511013
- DOI: 10.1073/pnas.0402090101
Noncompetitive allosteric inhibitors of the inflammatory chemokine receptors CXCR1 and CXCR2: prevention of reperfusion injury
Abstract
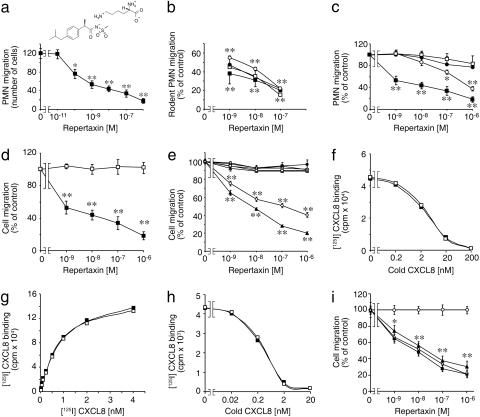
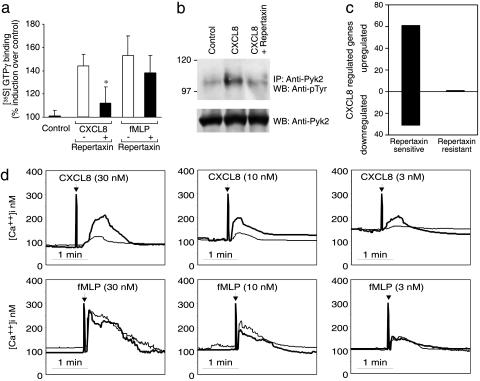
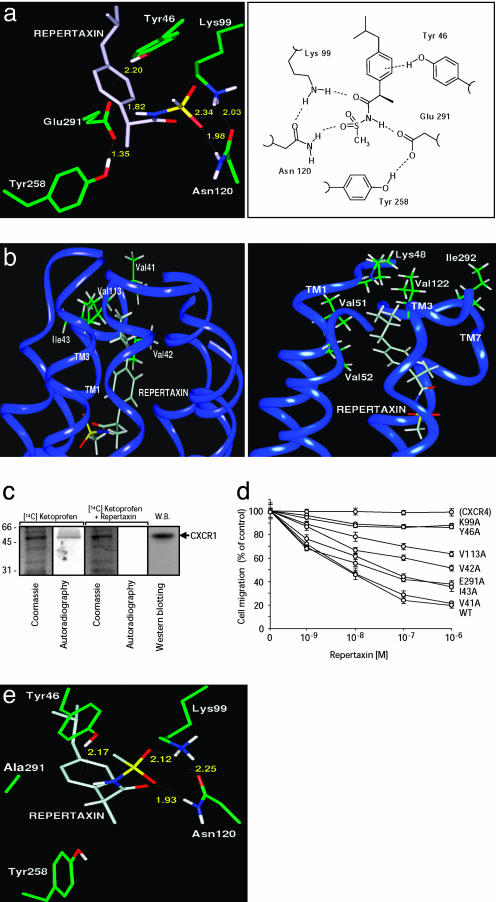
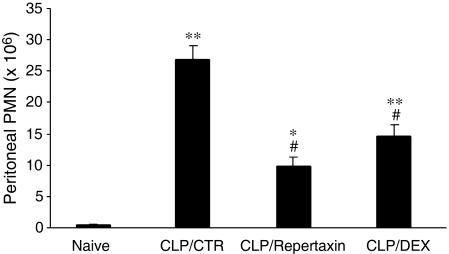
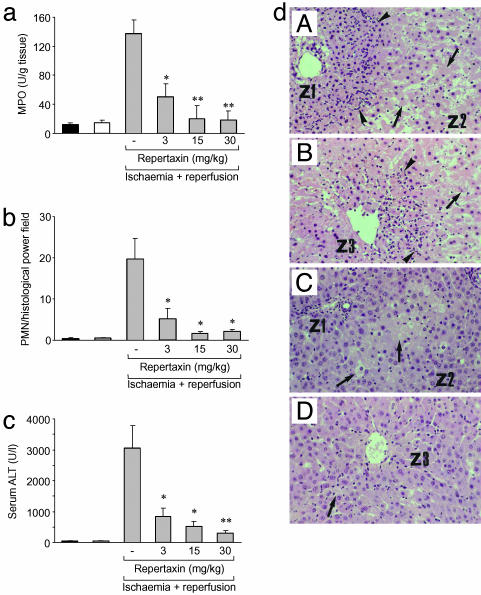
The chemokine CXC ligand 8 (CXCL8)/IL-8 and related agonists recruit and activate polymorphonuclear cells by binding the CXC chemokine receptor 1 (CXCR1) and CXCR2. Here we characterize the unique mode of action of a small-molecule inhibitor (Repertaxin) of CXCR1 and CXCR2. Structural and biochemical data are consistent with a noncompetitive allosteric mode of interaction between CXCR1 and Repertaxin, which, by locking CXCR1 in an inactive conformation, prevents signaling. Repertaxin is an effective inhibitor of polymorphonuclear cell recruitment in vivo and protects organs against reperfusion injury. Targeting the Repertaxin interaction site of CXCR1 represents a general strategy to modulate the activity of chemoattractant receptors.
Figures
Similar articles
-
Inhibition of interleukin-8 (CXCL8/IL-8) responses by repertaxin, a new inhibitor of the chemokine receptors CXCR1 and CXCR2.Biochem Pharmacol. 2005 Feb 1;69(3):385-94. doi: 10.1016/j.bcp.2004.10.007. Epub 2004 Dec 9. Biochem Pharmacol. 2005. PMID: 15652230
-
CXC chemokine receptor-1 is expressed by hepatocytes and regulates liver recovery after hepatic ischemia/reperfusion injury.Hepatology. 2011 Jan;53(1):261-71. doi: 10.1002/hep.24028. Epub 2010 Dec 7. Hepatology. 2011. PMID: 21254176 Free PMC article.
-
Neutrophil recruitment in the reperfused-injured rat liver was effectively attenuated by repertaxin, a novel allosteric noncompetitive inhibitor of CXCL8 receptors: a therapeutic approach for the treatment of post-ischemic hepatic syndromes.Int J Immunopathol Pharmacol. 2005 Jul-Sep;18(3):475-86. doi: 10.1177/039463200501800307. Int J Immunopathol Pharmacol. 2005. PMID: 16164828
-
Combined anti CXC receptors 1 and 2 therapy is a promising anti-inflammatory treatment for respiratory diseases by reducing neutrophil migration and activation.Pulm Pharmacol Ther. 2015 Oct;34:37-45. doi: 10.1016/j.pupt.2015.08.002. Epub 2015 Aug 10. Pulm Pharmacol Ther. 2015. PMID: 26271598 Review.
-
ELR+ CXC chemokines and their receptors (CXC chemokine receptor 1 and CXC chemokine receptor 2) as new therapeutic targets.Pharmacol Ther. 2006 Oct;112(1):139-49. doi: 10.1016/j.pharmthera.2006.04.002. Epub 2006 May 23. Pharmacol Ther. 2006. PMID: 16720046 Review.
Cited by
-
CXCR2: a target for pancreatic cancer treatment?Expert Opin Ther Targets. 2013 Jun;17(6):667-80. doi: 10.1517/14728222.2013.772137. Epub 2013 Feb 21. Expert Opin Ther Targets. 2013. PMID: 23425074 Free PMC article. Review.
-
A novel mechanism for adenylyl cyclase inhibition from the crystal structure of its complex with catechol estrogen.J Biol Chem. 2005 Sep 9;280(36):31754-9. doi: 10.1074/jbc.M507144200. Epub 2005 Jul 7. J Biol Chem. 2005. PMID: 16002394 Free PMC article.
-
Interleukin-8 Activates Breast Cancer-Associated Adipocytes and Promotes Their Angiogenesis- and Tumorigenesis-Promoting Effects.Mol Cell Biol. 2019 Jan 3;39(2):e00332-18. doi: 10.1128/MCB.00332-18. Print 2019 Jan 15. Mol Cell Biol. 2019. PMID: 30397072 Free PMC article.
-
Differentiated fibrocytes assume a functional mesenchymal phenotype with regenerative potential.Sci Adv. 2019 May 8;5(5):eaav7384. doi: 10.1126/sciadv.aav7384. eCollection 2019 May. Sci Adv. 2019. PMID: 31086819 Free PMC article.
-
Short-range interactions between fibrocytes and CD8+ T cells in COPD bronchial inflammatory response.Elife. 2023 Jul 26;12:RP85875. doi: 10.7554/eLife.85875. Elife. 2023. PMID: 37494277 Free PMC article.
References
-
- Mantovani, A. (1999) Immunol. Today 20, 254–257. - PubMed
-
- Rollins, B. J. (1997) Blood 90, 909–928. - PubMed
-
- Gerard, C. & Rollins, B. J. (2001) Nat. Immunol. 2, 108–115. - PubMed
-
- Murphy, P. M., Baggiolini, M., Charo, I. F., Hebert, C. A., Horuk, R., Matsushima, K., Miller, L. H., Oppenheim, J. J. & Power, C. A. (2000) Pharmacol. Rev. 52, 145–176. - PubMed
Publication types
MeSH terms
Substances
LinkOut - more resources
Full Text Sources
Other Literature Sources
Molecular Biology Databases
