

Kinetic profiles of p300 occupancy in vivo predict common features of promoter structure and coactivator recruitment
- PMID: 15286281
- PMCID: PMC511019
- DOI: 10.1073/pnas.0402156101
Kinetic profiles of p300 occupancy in vivo predict common features of promoter structure and coactivator recruitment
Abstract
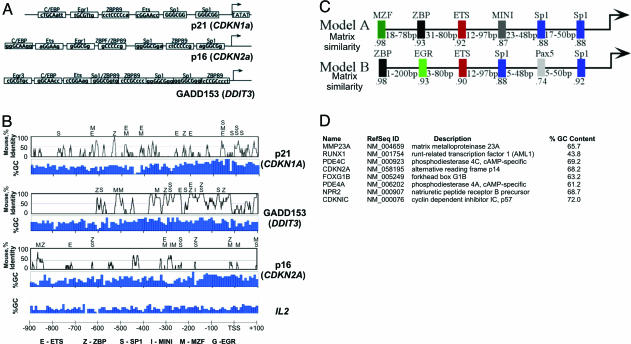
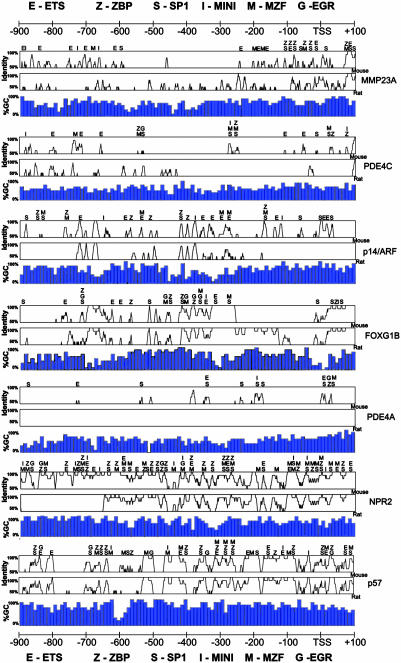
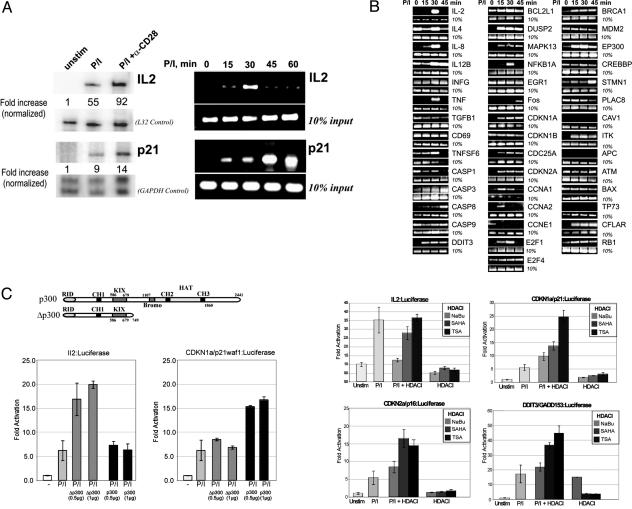
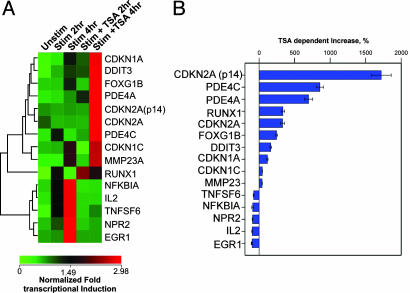
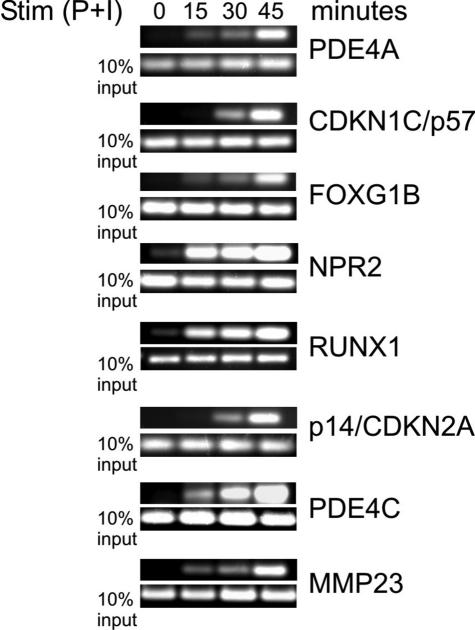
Understanding the language encrypted in the gene regulatory regions of the human genome is a challenging goal for the genomic era. Although customary extrapolations from steady-state mRNA levels have been effective, deciphering these regulatory codes will require additional empirical data sets that more closely reflect the dynamic progression of molecular events responsible for inducible transcription. We describe an approach using chromatin immunoprecipitation to profile the kinetic occupancy of the transcriptional coactivator and histone acetyltransferase p300 at numerous mitogen-induced genes in activated T cells. Comparison of these profiles reveals a class of promoters that share common patterns of inducible expression, p300 recruitment, dependence on selective p300 domains, and sensitivity to histone deacetylase inhibitors. Remarkably, this class also shares an evolutionarily conserved promoter composition and structure that accurately predicts additional human genes with similar functional attributes. This "reverse genomic" approach will have broad application for the genome-wide classification of promoter structure and function.
Figures
Similar articles
-
Endoplasmic reticulum stress induction of the Grp78/BiP promoter: activating mechanisms mediated by YY1 and its interactive chromatin modifiers.Mol Cell Biol. 2005 Jun;25(11):4529-40. doi: 10.1128/MCB.25.11.4529-4540.2005. Mol Cell Biol. 2005. PMID: 15899857 Free PMC article.
-
Down-regulation of p300/CBP histone acetyltransferase activates a senescence checkpoint in human melanocytes.Cancer Res. 2002 Nov 1;62(21):6231-9. Cancer Res. 2002. PMID: 12414652
-
Angiotensinogen gene expression is dependent on signal transducer and activator of transcription 3-mediated p300/cAMP response element binding protein-binding protein coactivator recruitment and histone acetyltransferase activity.Mol Endocrinol. 2002 Apr;16(4):824-36. doi: 10.1210/mend.16.4.0811. Mol Endocrinol. 2002. PMID: 11923478
-
Acetyltransferase machinery conserved in p300/CBP-family proteins.Oncogene. 2002 Mar 28;21(14):2253-60. doi: 10.1038/sj.onc.1205283. Oncogene. 2002. PMID: 11948408
-
CBP and p300: HATs for different occasions.Biochem Pharmacol. 2004 Sep 15;68(6):1145-55. doi: 10.1016/j.bcp.2004.03.045. Biochem Pharmacol. 2004. PMID: 15313412 Review.
Cited by
-
Interplay of bromodomain and histone acetylation in the regulation of p300-dependent genes.Epigenetics. 2010 Aug 16;5(6):509-15. doi: 10.4161/epi.5.6.12224. Epub 2010 Aug 16. Epigenetics. 2010. PMID: 20505343 Free PMC article.
-
BRCA1 and p53 regulate critical prostate cancer pathways.Prostate Cancer Prostatic Dis. 2013 Sep;16(3):233-8. doi: 10.1038/pcan.2013.12. Epub 2013 May 14. Prostate Cancer Prostatic Dis. 2013. PMID: 23670255 Free PMC article.
-
Role of Intrinsic Protein Disorder in the Function and Interactions of the Transcriptional Coactivators CREB-binding Protein (CBP) and p300.J Biol Chem. 2016 Mar 25;291(13):6714-22. doi: 10.1074/jbc.R115.692020. Epub 2016 Feb 5. J Biol Chem. 2016. PMID: 26851278 Free PMC article. Review.
-
Identification of new Rel/NFkappaB regulatory networks by focused genome location analysis.Cell Cycle. 2009 Jul 1;8(13):2093-100. doi: 10.4161/cc.8.13.8926. Epub 2009 Jul 5. Cell Cycle. 2009. PMID: 19502793 Free PMC article.
-
Association of Tat with promoters of PTEN and PP2A subunits is key to transcriptional activation of apoptotic pathways in HIV-infected CD4+ T cells.PLoS Pathog. 2010 Sep 16;6(9):e1001103. doi: 10.1371/journal.ppat.1001103. PLoS Pathog. 2010. PMID: 20862322 Free PMC article.
References
Publication types
MeSH terms
Substances
Grants and funding
LinkOut - more resources
Full Text Sources
Miscellaneous
