. 2004 Aug;135(4):1993-2011.
doi: 10.1104/pp.104.045468. Epub 2004 Jul 30.

Understanding in vivo benzenoid metabolism in petunia petal tissue

Affiliations

Understanding in vivo benzenoid metabolism in petunia petal tissue

Jennifer Boatright et al. Plant Physiol. 2004 Aug.

Abstract

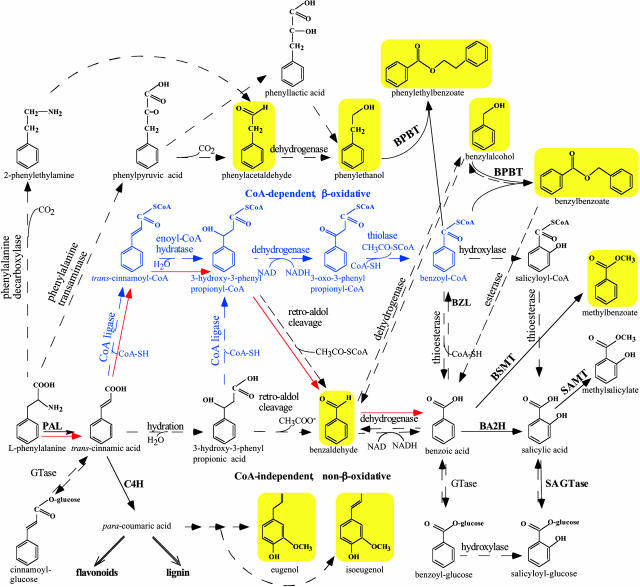
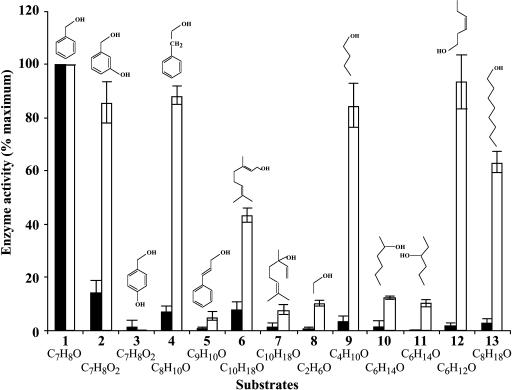
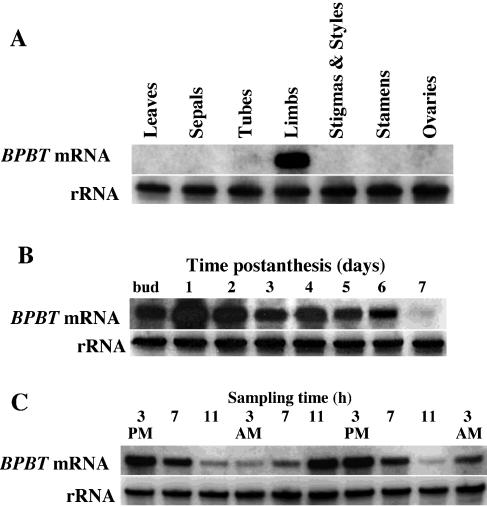
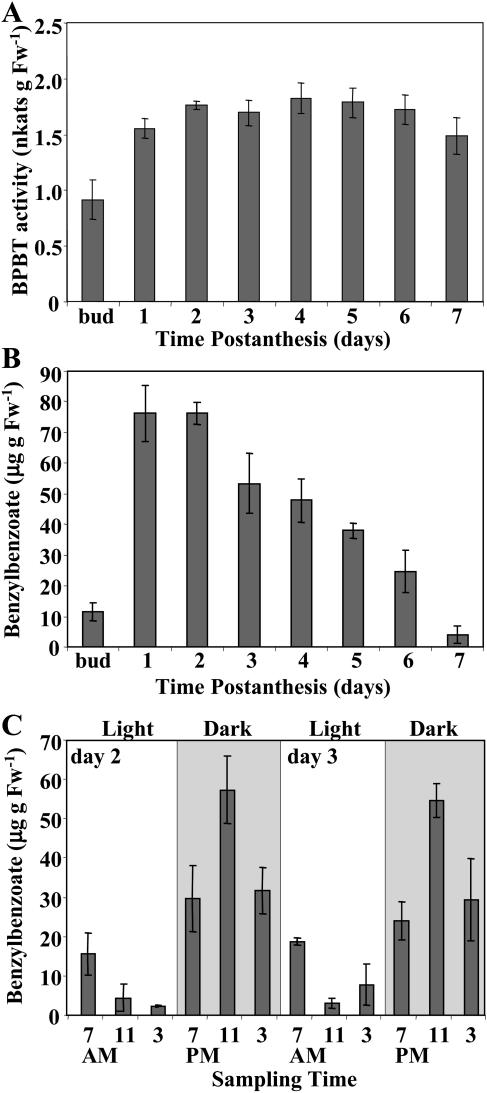
In vivo stable isotope labeling and computer-assisted metabolic flux analysis were used to investigate the metabolic pathways in petunia (Petunia hybrida) cv Mitchell leading from Phe to benzenoid compounds, a process that requires the shortening of the side chain by a C(2) unit. Deuterium-labeled Phe ((2)H(5)-Phe) was supplied to excised petunia petals. The intracellular pools of benzenoid/phenylpropanoid-related compounds (intermediates and end products) as well as volatile end products within the floral bouquet were analyzed for pool sizes and labeling kinetics by gas chromatography-mass spectrometry and liquid chromatography-mass spectrometry. Modeling of the benzenoid network revealed that both the CoA-dependent, beta-oxidative and CoA-independent, non-beta-oxidative pathways contribute to the formation of benzenoid compounds in petunia flowers. The flux through the CoA-independent, non-beta-oxidative pathway with benzaldehyde as a key intermediate was estimated to be about 2 times higher than the flux through the CoA-dependent, beta-oxidative pathway. Modeling of (2)H(5)-Phe labeling data predicted that in addition to benzaldehyde, benzylbenzoate is an intermediate between l-Phe and benzoic acid. Benzylbenzoate is the result of benzoylation of benzyl alcohol, for which activity was detected in petunia petals. A cDNA encoding a benzoyl-CoA:benzyl alcohol/phenylethanol benzoyltransferase was isolated from petunia cv Mitchell using a functional genomic approach. Biochemical characterization of a purified recombinant benzoyl-CoA:benzyl alcohol/phenylethanol benzoyltransferase protein showed that it can produce benzylbenzoate and phenylethyl benzoate, both present in petunia corollas, with similar catalytic efficiencies.


Figures

Figure 1.
Figure 1.
Proposed biosynthetic pathways leading to some benzenoid compounds in petunia. CoA-dependent, β-oxidative pathway of side chain shortening is shown in blue, whereas CoA-independent, non-β-oxidative pathway is shown in black. Red arrows show CoA-dependent and non-β-oxidative pathway. Solid arrows indicate established biochemical reactions, whereas broken arrows indicate possible steps not yet described. The conversion of cinnamoyl-CoA to benzoyl-CoA has already been described in mammals (Mao et al., 1994). BSMT and SAMT, S-adenosyl-l-Met:benzoic acid/salicylic acid and salicylic acid carboxyl methyltransferase, respectively; BA2H, benzoic acid 2-hydroxylase; BZL, benzoate:CoA ligase; C4H, cinnamic acid-4-hydroxylase; SA GTase, UDP-Glc:salicylic acid glucosyltransferase. Volatile benzenoid/phenylpropanoid-related compounds shown with a yellow background were analyzed in petunia floral scent and in petal tissue. Additionally, the pools of l-Phe and benzoic acid were also evaluated.
Figure 2.
Figure 2.
Emission of benzaldehyde (A) and phenylacetaldehyde (B) in petunia flowers during two normal light/dark cycles. Floral scent was collected from 1- and 2-d-old flowers during 48-h period under normal light/dark conditions. An increase of the maximum amplitude in 2-d-old flowers relative to 1-d-old flowers reflects the developmental changes in emission. Gray and white areas correspond to dark and light, respectively. Each graph represents the average of four independent experiments. sds are indicated by vertical bars.
Figure 3.
Figure 3.
Effect of Phe feeding on its distribution throughout petal tissue (A), endogenous Phe pool (B), PAL (C), and BSMT (D) mRNA gene expression and enzyme activities. Black and gray bars represent control (nonfed) and Phe-fed petunia flowers, respectively. A, [14C]Phe along with shown concentrations of unlabeled Phe was fed to petunia petals for 1 h. The top autoradiography shows label movement, and quantification of this movement is shown in the graph below. B, Quantification of endogenous Phe pool under experimental conditions. Graph represents the average of three independent experiments. sds are indicated by vertical bars. C and D, RNA blot analysis of PAL and BSMT mRNA levels (top) and PAL and BSMT activities (bottom graphs) in control and Phe-fed petal tissues at time points of sampling used in feeding experiments. Autoradiography of RNA blots was performed overnight. The blots were rehybridized with an 18S rDNA probe (bottom of top) to standardize samples. Each blot represents a typical result of three independent experiments, including the ones shown here. Enzyme assays were run in duplicate for each time point on at least five independent crude extract preparations for both PAL and BSMT activities, and the sds indicated by vertical bars were obtained.
Figure 4.
Figure 4.
GC-MS analysis of benzenoid and phenylpropanoid compounds produced by petunia petal tissue fed with Phe and 2H5-Phe for 4 h. The panel for each presented compound contains mass spectrum of authentic compound standard, mass spectrum of compound extracted from Phe-fed tissue (unlabeled), and mass spectrum representing a combination of unlabeled and labeled compound extracted from 2H5-Phe fed petal tissue (d5-labeled). All newly synthesized labeled benzenoid compounds exhibit a mass shift by 5 amu, except eugenol and isoeugenol, which exhibit a shift of only by 3 amu.
Figure 5.
Figure 5.
Identification of relationships between compounds within benzenoid network in petunia. A, In vivo labeling kinetics of benzenoid/phenylpropanoid compounds after feeding petal tissue with 2H5-Phe. Squares represent percent of labeled phenylacetaldehyde; diamonds, benzaldehyde; circles, benzoic acid; and triangles, methylbenzoate. Each point represents an average of results from at least three independent experiments. B, In vivo labeling kinetics of benzenoid/phenylpropanoid compounds after feeding petal tissue with 2H5-benzaldehyde. Black and white bars show percent of labeled and unlabeled compounds, respectively, together representing the entire (100%) pool. C, Effect of AIP, an inhibitor of PAL activity, on emission of benzenoid/phenylpropanoid compounds. Hatched and gray bars represent emission from petal tissue pretreated for 40 min with water and AIP, respectively, prior to supplying Phe for 4 h with simultaneous scent collection.
Figure 6.
Figure 6.
Metabolic modeling of in vivo labeling kinetics and pool sizes of benzenoid and phenylpropanoid compounds in petunia petal tissue supplied with 2H5-l-Phe for up to 4 h in the dark. A shows the metabolic scheme simulated. B, charts with white background show experimentally determined and simulated isotopic labeling of key intermediates and end products; charts with gray background show experimentally determined and simulated pool sizes of intermediates and end products. Symbols of different colors shown in B represent experimentally observed isotope abundances (% 2H5 [or 2H3 in the case of eugenol and isoeugenol]) and pool sizes of various metabolites (as measured by LC-MS or GC-MS) after supplying excised petunia petals with 2H5-Phe in the dark. Metabolites emitted to the gas phase are shaded in yellow in A. Black lines and curves shown in B represent computer-simulated values assuming the model of precursor-product relationships shown in A, and assuming the fluxes defined in the table on A and initial pool sizes defined below. Initial pool sizes at time T = 0 (min) (nmol g FW−1); endogenous l-Phe = 450; endogenous phenylacetaldehyde (PhAld) = 0.1; exogenous phenylacetaldehyde (PhAld; yellow shaded) = 0; endogenous phenylethanol (PhEth) = 0.1; endogenous CA = 10; endogenous 4-coumarate plus caffeate (Caff) = 25; endogenous isoeugenol (IEug) = 5; endogenous eugenol (Eug) = 1; endogenous benzoyl-CoA (BCoA) = 2; endogenous benzylbenzoate (BB) = 200 (benzoic acid moiety = BBa; benzyl alcohol moiety = BBb); endogenous benzyl alcohol (BAlc) = 14 [sum of a metabolic (2 nmol g FW−1)] and storage (s) (12 nmol g FW−1) pools]; endogenous benzaldehyde (BAld) = 6; exogenous benzaldehyde (BAld; yellow shaded) = 0; endogenous benzoic acid (BA) = 60; unidentified nonvolatile benzoic acid conjugate observed in LC-MS analyses of the methanolic extracts of petal tissue (C1) = 160; unidentified nonvolatile benzoic acid conjugate observed in LC-MS analyses of the methanolic extracts of petal tissue (C2) = 294; phenylethyl benzoate = 14; endogenous methylbenzoate (MB) [sum of a metabolic (5 nmol g FW−1)] and storage (s) (15 nmol g FW−1) pools] = 20; exogenous methylbenzoate (MB; yellow shaded) = 0. To display pool sizes on a single scale in charts with gray background, both observed and simulated pool sizes were multiplied by the following scaling factors: endogenous Phe = 1/200; endogenous PhAld = 1/4; exogenous PhAld = 1/4; endogenous PhEth = 1; endogenous benzylbenzoate (BBa and BBb) = 1/2; endogenous MB = 1/4; exogenous MB = 1/4; endogenous Eug and IEug = 1; endogenous C1 = 1/4; endogenous C2 = 1/10; endogenous and exogenous BAld = 1/2; endogenous BA = 1/4; endogenous phenylethyl benzoate (PEBa and PEBb) = 1/2. Pool size and labeling data were not acquired for the following endogenous metabolites in this labeling experiment: BCoA, CA, PhPyr/PhLac, and Caff. Phenylpyruvate and phenyllactic acid have been proposed as intermediates in PhEth synthesis in rose petals (Watanabe et al., 2002). De novo synthesis of unlabeled Phe from chorismate (Chor; v2) (and/or release of unlabeled Phe from protein via protein turnover) is assumed to contribute to a small isotope dilution of the endogenous Phe pool.
Figure 6.
Figure 6.
Metabolic modeling of in vivo labeling kinetics and pool sizes of benzenoid and phenylpropanoid compounds in petunia petal tissue supplied with 2H5-l-Phe for up to 4 h in the dark. A shows the metabolic scheme simulated. B, charts with white background show experimentally determined and simulated isotopic labeling of key intermediates and end products; charts with gray background show experimentally determined and simulated pool sizes of intermediates and end products. Symbols of different colors shown in B represent experimentally observed isotope abundances (% 2H5 [or 2H3 in the case of eugenol and isoeugenol]) and pool sizes of various metabolites (as measured by LC-MS or GC-MS) after supplying excised petunia petals with 2H5-Phe in the dark. Metabolites emitted to the gas phase are shaded in yellow in A. Black lines and curves shown in B represent computer-simulated values assuming the model of precursor-product relationships shown in A, and assuming the fluxes defined in the table on A and initial pool sizes defined below. Initial pool sizes at time T = 0 (min) (nmol g FW−1); endogenous l-Phe = 450; endogenous phenylacetaldehyde (PhAld) = 0.1; exogenous phenylacetaldehyde (PhAld; yellow shaded) = 0; endogenous phenylethanol (PhEth) = 0.1; endogenous CA = 10; endogenous 4-coumarate plus caffeate (Caff) = 25; endogenous isoeugenol (IEug) = 5; endogenous eugenol (Eug) = 1; endogenous benzoyl-CoA (BCoA) = 2; endogenous benzylbenzoate (BB) = 200 (benzoic acid moiety = BBa; benzyl alcohol moiety = BBb); endogenous benzyl alcohol (BAlc) = 14 [sum of a metabolic (2 nmol g FW−1)] and storage (s) (12 nmol g FW−1) pools]; endogenous benzaldehyde (BAld) = 6; exogenous benzaldehyde (BAld; yellow shaded) = 0; endogenous benzoic acid (BA) = 60; unidentified nonvolatile benzoic acid conjugate observed in LC-MS analyses of the methanolic extracts of petal tissue (C1) = 160; unidentified nonvolatile benzoic acid conjugate observed in LC-MS analyses of the methanolic extracts of petal tissue (C2) = 294; phenylethyl benzoate = 14; endogenous methylbenzoate (MB) [sum of a metabolic (5 nmol g FW−1)] and storage (s) (15 nmol g FW−1) pools] = 20; exogenous methylbenzoate (MB; yellow shaded) = 0. To display pool sizes on a single scale in charts with gray background, both observed and simulated pool sizes were multiplied by the following scaling factors: endogenous Phe = 1/200; endogenous PhAld = 1/4; exogenous PhAld = 1/4; endogenous PhEth = 1; endogenous benzylbenzoate (BBa and BBb) = 1/2; endogenous MB = 1/4; exogenous MB = 1/4; endogenous Eug and IEug = 1; endogenous C1 = 1/4; endogenous C2 = 1/10; endogenous and exogenous BAld = 1/2; endogenous BA = 1/4; endogenous phenylethyl benzoate (PEBa and PEBb) = 1/2. Pool size and labeling data were not acquired for the following endogenous metabolites in this labeling experiment: BCoA, CA, PhPyr/PhLac, and Caff. Phenylpyruvate and phenyllactic acid have been proposed as intermediates in PhEth synthesis in rose petals (Watanabe et al., 2002). De novo synthesis of unlabeled Phe from chorismate (Chor; v2) (and/or release of unlabeled Phe from protein via protein turnover) is assumed to contribute to a small isotope dilution of the endogenous Phe pool.
Figure 7.
Figure 7.
Comparison of the predicted amino acid sequence of petunia BPBT with related proteins. Petunia BPBT sequence (PhBPBT) was aligned with BEBT from N. tabacum (NtBEBT, AAN09798), BEBT from C. breweri (CbBEBT, AAN09796), CHAT from Arabidopsis (AtCHAT, AAN09797), and BEAT from C. breweri (CbBEAT, AAC18062) using ClustalW. This alignment was shaded using Boxshade 3.21 software program (Human Genome Sequencing Center, Houston). Residues shaded in black indicate conserved amino acids identical in least two sequences shown, unless two of the others are identical to each other, and residues shaded in gray represent similar matches. Dashes indicate gaps that have been inserted for optimal alignment. Stars and diamonds indicate the HxxxD and DFGWG motifs, respectively.
Figure 8.
Figure 8.
Comparisons of relative specific activities of petunia BPBT with a variety of substrates. Black and white bars represent activities with acetyl-CoA and benzoyl-CoA, respectively, and indicated alcohol cosubstrates. In both cases activity with benzyl alcohol was set to 100% and was 10.2 ± 1.2 nkat/mg protein and 19.7 ± 3.4 nkat/mg protein in presence of acetyl-CoA and benzoyl-CoA, respectively. Alcohol substrates were as follows: 1, benzyl alcohol; 2, 3-hydroxy-benzyl alcohol; 3, 4-hydroxy-benzyl alcohol; 4, 2-phenylethanol, 5, cinnamyl alcohol; 6, geraniol; 7, linalool; 8, ethanol; 9, butanol; 10, 2-hexanol; 11, 3-hexanol; 12, cis-3-hexen-1-ol; and 13, 1-octanol. Each point is the average of three independent experiments. se values are indicated by vertical bars.
Figure 9.
Figure 9.
Characterization of petunia BPBT gene expression. A, Tissue specificity of BPBT mRNA. RNA gel blot of total RNA (5 μg per lane) isolated from young leaves, sepals, tubes, and limbs of corollas, pistil, stamens, and ovaries of 2-d-old petunia flowers. The top gel represents the results of hybridization with a coding region of the BPBT genes as a probe. Autoradiography was performed overnight. The blot shown here as well as in B and C were rehybridized with an 18S rDNA probe (bottom) to standardize samples. B, Developmental changes in steady-state BPBT mRNA level in limbs of petunia corollas. Total RNA was isolated at different stages of flower development, from mature buds to day 7 postanthesis. Each lane contained 5 μg of total RNA. Autoradiography was performed overnight. C, RNA gel-blot analysis of steady-state BPBT mRNA levels in petunia flowers during a normal light/dark cycle. Total RNA was isolated from limbs of 2- and 3-d-old flowers at time points indicated at top of figure, and 5 μg of total RNA was loaded in each lane. Autoradiography was performed overnight.
Figure 10.
Figure 10.
Characterization of the BPBT activity (A) and internal pools of benzylbenzoate during flower development (B) and two daily light/dark cycles (C) in petunia petals. Each graph represents the average of three independent experiments. sds are indicated by vertical bars. Gray and white areas in C correspond to dark and light, respectively.

References

    1. Ahmed MA, El-Mawla A, Beerhues L (2002) Benzoic acid biosynthesis in cell cultures of Hypericum androsaemum. Planta 214: 727–733 - PubMed
    1. Alibert G, Ranjeva R (1971) Research on the enzymes catalyzing the biosynthesis of phenolic acids in Quercus pedunculata (Ehrh.): I – Formation of the first members of the cinnamic series and benzoic series. FEBS Lett 19: 11–14 - PubMed
    1. Anterola AM, Jeon JH, Davin LB, Lewis NG (2002) Transcriptional control of monolignol biosynthesis in Pinus taeda: factors affecting monolignol ratios and carbon allocation in phenylpropanoid metabolism. J Biol Chem 277: 18272–18280 - PubMed
    1. Appert C, Zon J, Amrhein N (2003) Kinetic analysis of the inhibition of phenylalanine ammonia-lyase by 2-aminoindan-2-phosphonic acid and other phenylalanine analogues. Phytochemistry 62: 415–422 - PubMed
    1. Bailey JE (1998) Mathematical modeling and analysis in biochemical engineering: past accomplishments and future opportunities. Biotechnol Prog 14: 8–20 - PubMed

Publication types

Associated data

LinkOut - more resources