Comparative Study
. 2004 Aug;135(4):2398-410.
doi: 10.1104/pp.104.041012. Epub 2004 Jul 30.

Metabolic discrimination of Catharanthus roseus leaves infected by phytoplasma using 1H-NMR spectroscopy and multivariate data analysis

Affiliations
Comparative Study

Metabolic discrimination of Catharanthus roseus leaves infected by phytoplasma using 1H-NMR spectroscopy and multivariate data analysis

Young Hae Choi et al. Plant Physiol. 2004 Aug.

Abstract

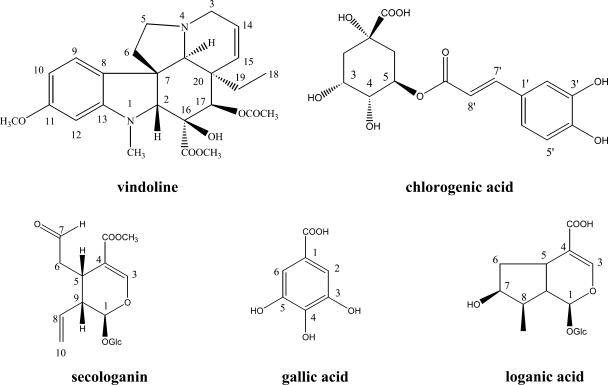
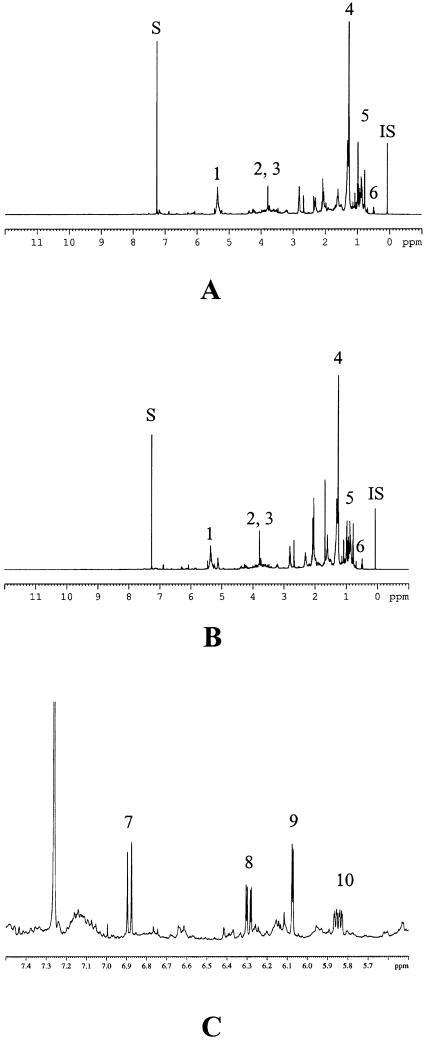
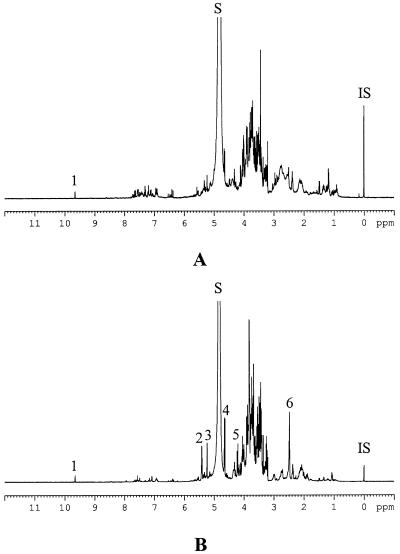
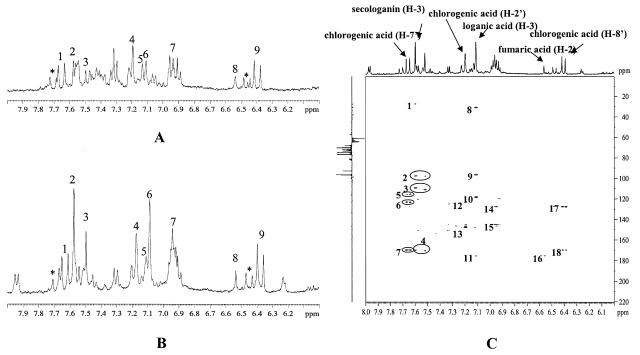
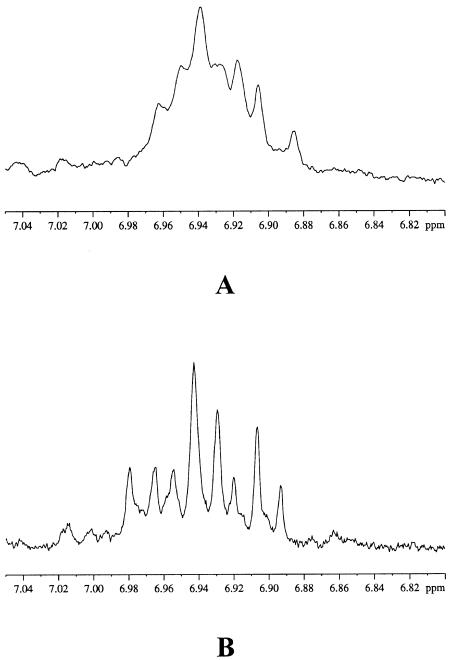
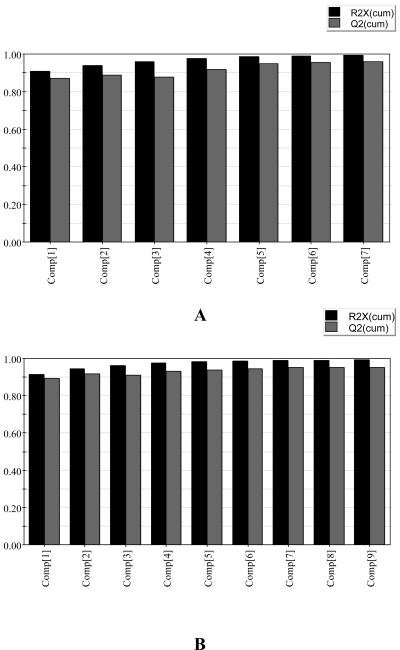
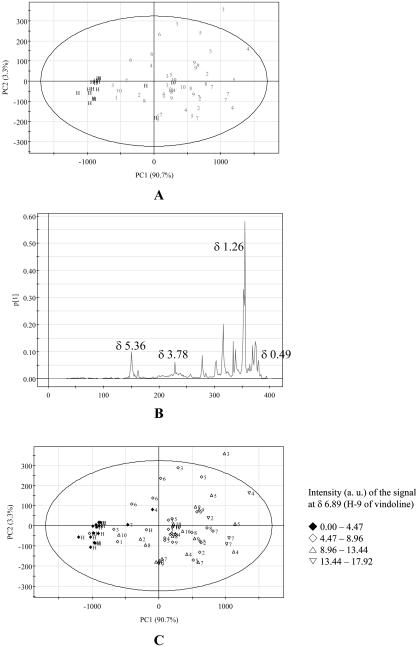
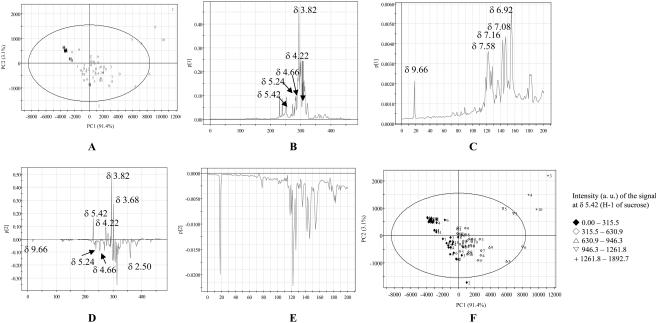
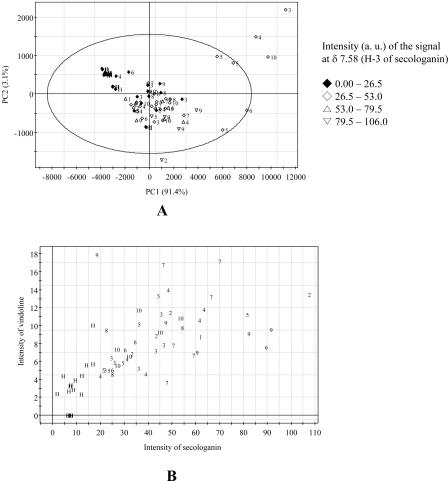
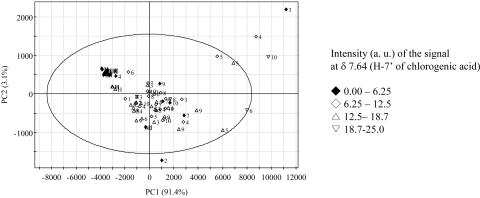
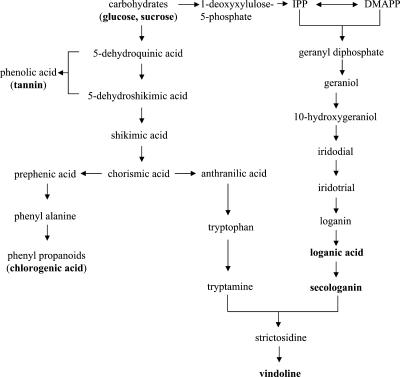
A comprehensive metabolomic profiling of Catharanthus roseus L. G. Don infected by 10 types of phytoplasmas was carried out using one-dimensional and two-dimensional NMR spectroscopy followed by principal component analysis (PCA), an unsupervised clustering method requiring no knowledge of the data set and used to reduce the dimensionality of multivariate data while preserving most of the variance within it. With a combination of these techniques, we were able to identify those metabolites that were present in different levels in phytoplasma-infected C. roseus leaves than in healthy ones. The infection by phytoplasma in C. roseus leaves causes an increase of metabolites related to the biosynthetic pathways of phenylpropanoids or terpenoid indole alkaloids: chlorogenic acid, loganic acid, secologanin, and vindoline. Furthermore, higher abundance of Glc, Glu, polyphenols, succinic acid, and Suc were detected in the phytoplasma-infected leaves. The PCA of the (1)H-NMR signals of healthy and phytoplasma-infected C. roseus leaves shows that these metabolites are major discriminating factors to characterize the phytoplasma-infected C. roseus leaves from healthy ones. Based on the NMR and PCA analysis, it might be suggested that the biosynthetic pathway of terpenoid indole alkaloids, together with that of phenylpropanoids, is stimulated by the infection of phytoplasma.


Figures

Figure 1.
Figure 1.
Chemical structures of vindoline, chlorogenic acid, secologanin, loganic acid, and gallic acid.
Figure 2.
Figure 2.
1H-NMR spectra of CHCl3 extract of healthy C. roseus leaves (A), phytoplasma (BLL)-infected C. roseus leaves (B), and expansion part [phytoplasma (BLL)-infected leaves] in the range of δ 5.5 to δ 7.5 (C). 1, olefinic signals of fatty components or terpenoids; 2, OCH3 of C-11 of vindoline; 3, OCH3 of C-22 of vindoline; 4, long chain CH2 of fatty component; 5, steroidal or triterpenoidal CH3; 6, H-18 of vindoline; 7, H-9 of vindoline; 8, H-10 of vindoline; 9, H-12 of vindoline; 10, H-14 of vindoline; S, residual CHCl3 signal; IS, internal standard (HMDS).
Figure 3.
Figure 3.
1H-NMR spectra of water extract of healthy C. roseus leaves (A) and phytoplasma (UDINESE)-infected C. roseus leaves (B). 1, aldehyde signal of secologanin; 2, H-1 of Suc; 3, H-1 of α-Glc; 4, H-1 of β-Glc; 5, H-1 of Fru in Suc; 6, succinic acid; S, residual water signal; IS, internal standard (TSP).
Figure 4.
Figure 4.
1H-NMR spectra of water extract of healthy C. roseus leaves (A) and phytoplasma (UDINESE)-infected C. roseus leaves (B) in the range of δ 6.0 to δ 8.0, and HMBC spectra of water fraction of phytoplasma (UDINESE)-infected (C) C. roseus leaves. In 1H-NMR spectra (A and B): 1, H-7′ of chlorogenic acid; 2 and 3, H-3 of secologanin; 4, H-2′ of chlorogenic acid; 5, H-6′ of chlorogenic acid; 6, H-3 of loganic acid; 7, H-5′ of chlorogenic acid and aromatic signals of polyphenols; 8, fumaric acid; 9, H-8′ of chlorogenic acid; *, possible signals of chlorogenic acid derivatives. In HMBC spectra (C): 1, correlation of H-3 and C-5 of secologanin; 2, correlation of H-3 and C-1 of secologanin; 3, correlation of H-3 and C-4 of secologanin; 4, correlation of H-3 and carbonyl group of secologanin; 5, correlation of H-7′ and C-2′ of chlorogenic acid; 6, correlation of H-7′ and C-6′ of chlorogenic acid; 7, correlation of H-7′ and carbonyl group of chlorogenic acid; 8, correlation of H-3 and C-5 of loganic acid; 9, correlation of H-3 and C-1 of loganic acid; 10, correlation of H-3 and C-4 of loganic acid; 11, correlation of correlation of H-3 and carbonyl group of loganic acid; 12, correlation of H-2′ and C-1′ of chlorogenic acid; 13, correlation of H-2′ and C-3′; 14, correlation of H-2 and C-1 of gallic acid derivatives; 15, correlation of H-2 and C-3 of gallic acid derivatives; 16, correlation of H-2 and carbonyl group of fumaric acid; 17, correlation of H-8′ and C-1′ of chlorogenic acid; 18, correlation of H-8′ and carbonyl group of chlorogenic acid.
Figure 5.
Figure 5.
1H-NMR spectra of water extract of C. roseus leaves infected by phytoplasma (UDINESE) with 400 MHz (A) and with 600 MHz (B) in the range of δ 7.05 to δ 6.80.
Figure 6.
Figure 6.
Principal components explaining variances used in PCA of 1H-NMR data set of C. roseus leaves. A, CHCl3 extract; B, water extract.
Figure 7.
Figure 7.
Score and loading plot of PCA of the CHCl3 extracts of healthy and phytoplasma-infected C. roseus leaves. A, score plot; B, loading plot of PC1; C, score plot with the intensity of H-9 of vindoline in 1H-NMR spectra. 1, AP; 2, BLL; 3, DYON; 4, MOL; 5, PPT; 6, SMBB; 7, STOF; 8, STOL; 9, TBB; 10, UDINESE; H, healthy. The ellipse represents the Hotelling T2 with 95% confidence in score plots.
Figure 8.
Figure 8.
Score and loading plot of PCA of water extracts of healthy and infected C. roseus leaves by phytoplasmas. A, score plot; B, loading plot of PC1 in the range of δ 0.3 to δ 10.0; C, loading plot of PC1 in the range of δ 6.0 to δ 10.0; D, loading plot of PC2 in the range of δ 0.3 to δ 10.0; E, loading plot of PC1 in the range of δ 6.0 to δ 10.0; F, score plot with the intensity of H-1 signal at δ 5.42 of Suc in 1H-NMR spectra. 1, AP; 2, BLL; 3, DYON; 4, MOL; 5, PPT; 6, SMBB; 7, STOF; 8, STOL; 9, TBB; 10, UDINESE; H, healthy. The ellipse represents the Hotelling T2 with 95% confidence in score plots.
Figure 9.
Figure 9.
Score plot with the intensity of H-3 signal at δ 7.58 of Suc in 1H-NMR spectra (A), and correlation plot between secologanin and vindoline (B). 1, AP; 2, BLL; 3, DYON; 4, MOL; 5, PPT; 6, SMBB; 7, STOF; 8, STOL; 9, TBB; 10, UDINESE; H, healthy. The ellipse represents the Hotelling T2 with 95% confidence in score plot. The 1H-NMR signals at δ 5.24 (H-1), δ 7.58 (H-3), δ 5.42 (H-1), δ 6.89 (H-10) were used for the analysis of the intensity of Glc, secologanin, Suc, and vindoline, respectively. The ellipse represents the Hotelling T2 with 95% confidence in score plots.
Figure 10.
Figure 10.
Score plot with the intensity of H-7′ signal at δ 7.64 of Suc in 1H-NMR spectra. 1, AP; 2, BLL; 3, DYON; 4, MOL; 5, PPT; 6, SMBB; 7, STOF; 8, STOL; 9, TBB; 10, UDINESE; H, healthy. The ellipse represents the Hotelling T2 with 95% confidence in score plot.
Figure 11.
Figure 11.
Schematic pathway for the biosynthesis of terpenoid indole alkaloid, phenylpropanoid, and phenolic acid. The increased metabolites in C. roseus leaves infected by phytoplasma are in boldface.

Similar articles

Cited by

References

    1. Agrawal PK (1992) NMR spectroscopy in the structural elucidation of oligosaccharides and glycosides. Phytochemistry 31: 3307–3330 - PubMed
    1. Bailey NJ, Oven M, Holmes E, Nicholson JK, Zenk MH (2003) Metabolomic analysis of the consequences of cadmium exposure in Silene cucubalus cell cultures via 1H-NMR spectroscopy and chemometrics. Phytochemistry 62: 851–858 - PubMed
    1. Batjer LP, Schneider H (1960) Relation of pear decline to rootstocks and sieve-tube necrosis. Proc Am Soc Hortic Sci 76: 85–97
    1. Catlin PB, Olsson EA, Beutel JA (1975) Reduced translocation of carbon and nitrogen from leaves with symptoms of pear curl. J Am Soc Hortic Sci 100: 184–187
    1. Dixon RA (2001) Natural products and disease resistance. Nature 411: 843–847 - PubMed

Publication types

MeSH terms

LinkOut - more resources