

Impaired glucose homeostasis in transgenic mice expressing the human transient neonatal diabetes mellitus locus, TNDM
- PMID: 15286800
- PMCID: PMC484972
- DOI: 10.1172/JCI19876
Impaired glucose homeostasis in transgenic mice expressing the human transient neonatal diabetes mellitus locus, TNDM
Abstract
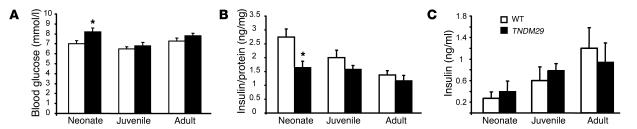
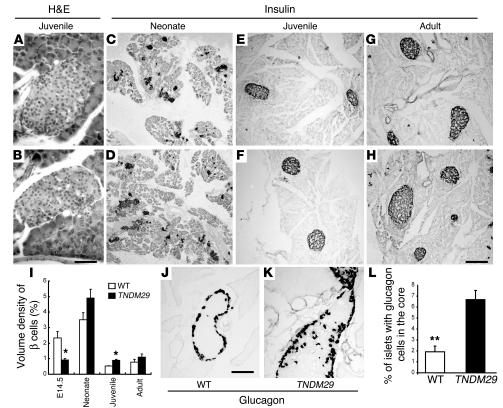
Transient neonatal diabetes mellitus (TNDM) is a rare inherited diabetic syndrome apparent in the first weeks of life and again during early adulthood. The relative contributions of reduced islet beta cell number and impaired beta cell function to the observed hypoinsulinemia are unclear. The inheritance pattern of this imprinted disorder implicates overexpression of one or both genes within the TNDM locus: ZAC, which encodes a proapoptotic zinc finger protein, and HYMAI, which encodes an untranslated mRNA. To investigate the consequences for pancreatic function, we have developed a high-copy transgenic mouse line, TNDM29, carrying the human TNDM locus. TNDM29 neonates display hyperglycemia, and older adults, impaired glucose tolerance. Neonatal hyperglycemia occurs only on paternal transmission, analogous to paternal dependence of TNDM in humans. Embryonic pancreata of TNDM29 mice showed reductions in expression of endocrine differentiation factors and numbers of insulin-staining structures. By contrast, beta cell mass was normal or elevated at all postnatal stages, whereas pancreatic insulin content in neonates and peak serum insulin levels after glucose infusion in adults were reduced. Expression of human ZAC and HYMAI in these transgenic mice thus recapitulates key features of TNDM and implicates impaired development of the endocrine pancreas and beta cell function in disease pathogenesis.
Figures


Comment in
-
Unlocking the secrets of the pancreatic beta cell: man and mouse provide the key.J Clin Invest. 2004 Aug;114(3):314-6. doi: 10.1172/JCI22506. J Clin Invest. 2004. PMID: 15286795 Free PMC article. Review.
Similar articles
-
Unlocking the secrets of the pancreatic beta cell: man and mouse provide the key.J Clin Invest. 2004 Aug;114(3):314-6. doi: 10.1172/JCI22506. J Clin Invest. 2004. PMID: 15286795 Free PMC article. Review.
-
[Effects of severe hyperglycaemia in pregnancy and early overfeeding on islet development and insulin resistance].Zhonghua Fu Chan Ke Za Zhi. 2010 Sep;45(9):658-63. Zhonghua Fu Chan Ke Za Zhi. 2010. PMID: 21092544 Chinese.
-
Relaxation of imprinted expression of ZAC and HYMAI in a patient with transient neonatal diabetes mellitus.Hum Genet. 2002 Feb;110(2):139-44. doi: 10.1007/s00439-001-0671-5. Epub 2002 Jan 24. Hum Genet. 2002. PMID: 11935319
-
Overexpression of a dominant negative GIP receptor in transgenic mice results in disturbed postnatal pancreatic islet and beta-cell development.Regul Pept. 2005 Feb 15;125(1-3):103-17. doi: 10.1016/j.regpep.2004.08.021. Regul Pept. 2005. PMID: 15582721
-
Islet dysfunction in non-insulin-dependent diabetes mellitus.Am J Med. 1988 Nov 28;85(5A):4-8. doi: 10.1016/0002-9343(88)90392-0. Am J Med. 1988. PMID: 3057894 Review.
Cited by
-
Unlocking the secrets of the pancreatic beta cell: man and mouse provide the key.J Clin Invest. 2004 Aug;114(3):314-6. doi: 10.1172/JCI22506. J Clin Invest. 2004. PMID: 15286795 Free PMC article. Review.
-
Overexpression of ZAC impairs glucose-stimulated insulin translation and secretion in clonal pancreatic beta-cells.Diabetes Metab Res Rev. 2012 Nov;28(8):645-53. doi: 10.1002/dmrr.2325. Diabetes Metab Res Rev. 2012. PMID: 22865650 Free PMC article.
-
Transgenerational glucose intolerance with Igf2/H19 epigenetic alterations in mouse islet induced by intrauterine hyperglycemia.Diabetes. 2012 May;61(5):1133-42. doi: 10.2337/db11-1314. Epub 2012 Mar 23. Diabetes. 2012. PMID: 22447856 Free PMC article.
-
ZAC, LIT1 (KCNQ1OT1) and p57KIP2 (CDKN1C) are in an imprinted gene network that may play a role in Beckwith-Wiedemann syndrome.Nucleic Acids Res. 2005 May 11;33(8):2650-60. doi: 10.1093/nar/gki555. Print 2005. Nucleic Acids Res. 2005. PMID: 15888726 Free PMC article.
-
Aberrantly expressed genes and miRNAs in human hypopharyngeal squamous cell carcinoma based on RNA‑sequencing analysis.Oncol Rep. 2018 Aug;40(2):647-658. doi: 10.3892/or.2018.6506. Epub 2018 Jun 19. Oncol Rep. 2018. PMID: 29916534 Free PMC article.
References
-
- Temple IK, et al. Transient neonatal diabetes: widening the understanding of the etiopathogenesis of diabetes. Diabetes. 2000;49:1359–1366. - PubMed
-
- Shield JP, et al. Variable evidence of pancreatic insufficiency in those children with transient neonatal diabetes mellitus in remission. Pediatr. Res. 2001;49(Suppl. P2):619.
-
- Blum D, et al. Congenital absence of insulin cells in a neonate with diabetes mellitus and mutase-deficient methylmalonic acidaemia. Diabetologia. 1993;36:352–357. - PubMed
Publication types
MeSH terms
Substances
Grants and funding
LinkOut - more resources
Full Text Sources
Medical
Molecular Biology Databases
