Comparative Study
. 2004 Aug;114(3):357-69.
doi: 10.1172/JCI21620.

Regulation of hypothalamic prohormone convertases 1 and 2 and effects on processing of prothyrotropin-releasing hormone

Affiliations
Comparative Study

Regulation of hypothalamic prohormone convertases 1 and 2 and effects on processing of prothyrotropin-releasing hormone

Vanesa C Sanchez et al. J Clin Invest. 2004 Aug.

Abstract

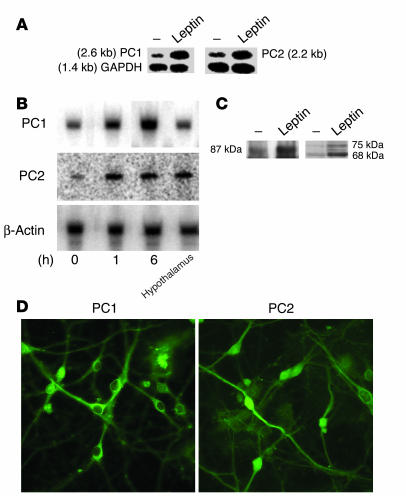
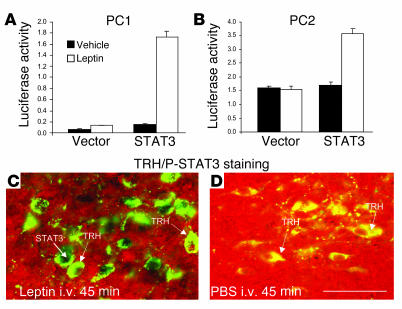
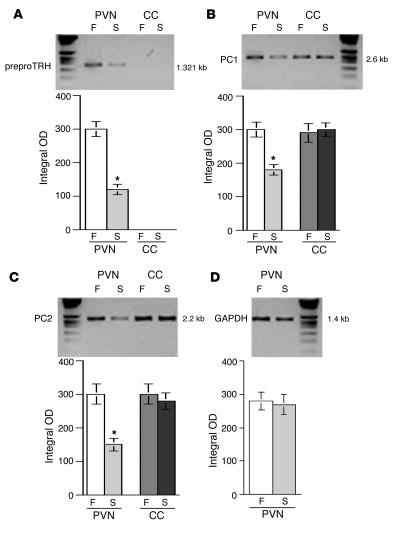
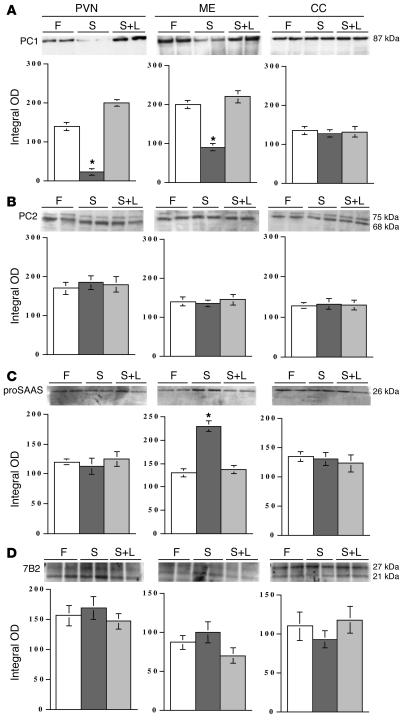
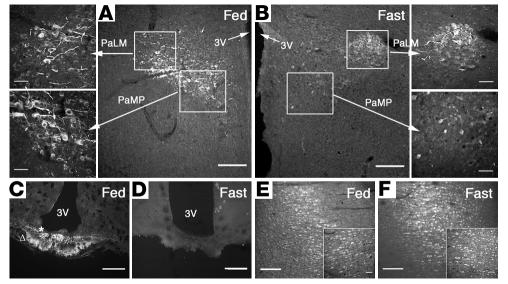
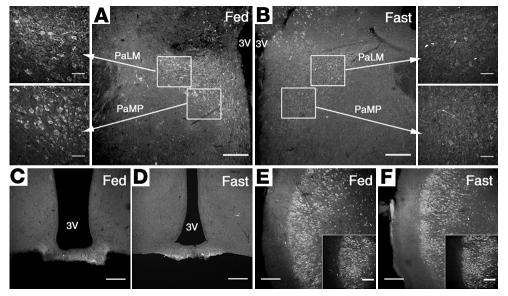
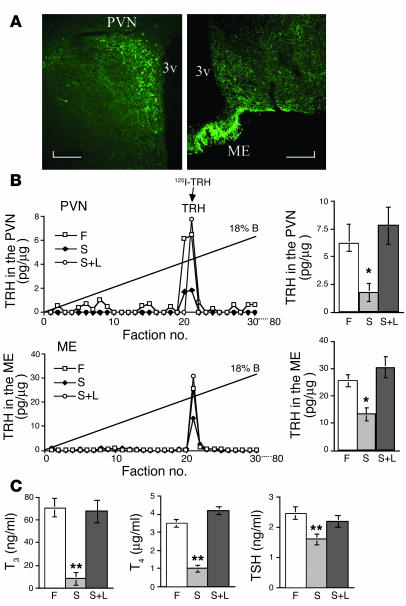
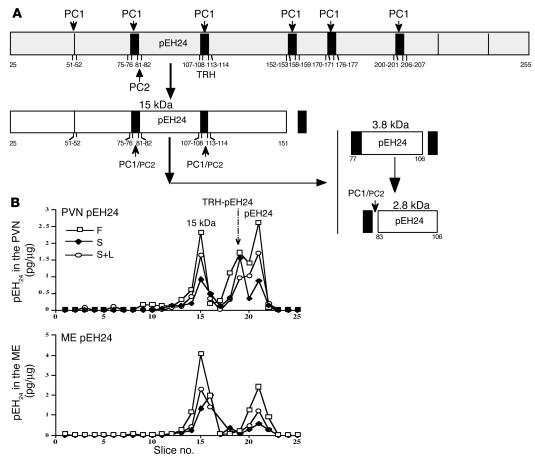
Regulation of energy balance by leptin involves regulation of several neuropeptides, including thyrotropin-releasing hormone (TRH). Synthesized from a larger inactive precursor, its maturation requires proteolytic cleavage by prohormone convertases 1 and 2 (PC1 and PC2). Since this maturation in response to leptin requires prohormone processing, we hypothesized that leptin might regulate hypothalamic PC1 and PC2 expression, ultimately leading to coordinated processing of prohormones into mature peptides. Using hypothalamic neurons, we found that leptin stimulated PC1 and PC2 mRNA and protein expression and also increased PC1 and PC2 promoter activities in transfected 293T cells. Starvation of rats, leading to low serum leptin levels, decreased PC1 and PC2 gene and protein expression in the paraventricular nucleus (PVN) of the hypothalamus. Exogenous administration of leptin to fasted animals restored PC1 levels in the median eminence (ME) and the PVN to approximately the level found in fed control animals. Consistent with this regulation of PCs in the PVN, concentrations of TRH in the PVN and ME were substantially reduced in the fasted animals relative to the fed animals, and leptin reversed this decrease. Further analysis showed that proteolytic cleavage of pro-thyrotropin-releasing hormone (proTRH) at known PC cleavage sites was reduced by fasting and increased in animals given leptin. Combined, these findings suggest that leptin-dependent stimulation of hypothalamic TRH expression involves both activation of trh transcription and stimulation of PC1 and PC2 expression, which lead to enhanced processing of proTRH into mature TRH.


Figures

Figure 1
Figure 1
Leptin stimulates PC1 and PC2 mRNA and protein levels in primary hypothalamic neuronal cultures. (A) Northern blot analysis of leptin-treated primary neurons. Primary neuronal hypothalamic cultures were serum-deprived overnight and then treated with leptin for 6 hours. Total RNA was then isolated and subjected to Northern blotting. The upper bands are PC1 mRNA (left) and PC2 mRNA (right). The lower bands are GAPDH mRNA. Cells were left untreated or treated with 5 nM or 10 nM leptin for 6 hours. PC1, PC2, and GAPDH mRNA had the expected sizes of 2.6, 2.2, and 1.4 kb, respectively. (B) Time-dependent 32P-RT-PCR analysis in leptin-treated primary hypothalamic neurons. Primary neuronal hypothalamic cultures were serum-deprived overnight and then treated with 10 nM leptin for various periods of time. Total RNA was then subjected to quantitative 32P-RT-PCR using a limiting number of PCR cycles as described in Methods. The same amount of total RNA from adult rat hypothalamic tissue was analyzed in parallel. The upper panel represents PC1 mRNA and the middle panel PC2 mRNA. Bands in the lower panel represent levels of β-actin mRNA in the same samples, which did not change with time or treatment. (C) Western blot analysis for PC1 and PC2 in samples extracted from hypothalamic neurons treated with leptin. Hypothalamic neurons were treated with 10 nM leptin for 6 hours. Protein lysates were then subjected to Western blotting for PC1 and PC2 proteins. PC1 and PC2 migrated with expected molecular masses of 87 kDa and the processed form of 75 and 68 kDa, respectively. (D) Typical immunostaining distribution for PC1 and PC2 in primary cultures of hypothalamic neurons.
Figure 2
Figure 2
Leptin stimulates PC1 and PC2 promoter activity via STAT3 in transfected cells and activates STAT3 in TRH neurons in vivo. 293T cells were transfected with ObRb cDNAs together with PC1 (A) or PC2 (B) promoter-luciferase reporter plasmids, and STAT3 expression vector or the corresponding empty vector was also cotransfected as indicated. A CMV-lacZ control plasmid was included in all transfections to correct for differences in transfection efficiencies. Serum-deprived cells were left unstimulated or treated with 20 nM leptin for 6 hours, and luciferase activities were measured in the cell lysates. Luciferase activities were normalized with β-galactosidase activities measured in the same samples. This experiment was performed 3 times, each one in triplicate. Shown are means ± SE. β-Galactosidase activities did not change with treatments. (C and D) Leptin-dependent STAT3 phosphorylation in TRH neurons in the PVN of rats. Animals were given a single i.v. injection of recombinant leptin (1.0 mg/kg) or vehicle (PBS) and killed 45 minutes later. Coronal brain sections were obtained and subjected to double IHC using anti–P-STAT3 nuclear (brown staining) and anti-proTRH cytoplasmic (green fluorescence) antiserum. Scale bar: 10 μm.
Figure 3
Figure 3
Analysis of fasting- and leptin-induced regulation of PC1 and PC2 mRNA in the PVN and ME of rats. (AD) A typical quantitative 32P-RT-PCR for TRH, PC1, and PC2 using a limiting number of PCR cycles (see Methods) in PVN and CC tissues derived from fed (F) and starved (S) animals. Integrated optical density using NIH Image software for PC1, PC2, and TRH in the 2 brain areas was analyzed. ANOVA was followed by a multiple comparison using a Tukey-Kramer test. *P < 0.01, significant difference at this level. GAPDH mRNA was analyzed as an endogenous control.
Figure 4
Figure 4
Analysis of fasting- and leptin-induced regulation of PC1 and PC2 proteins in the PVN and ME of rats. The upper panels in AD depict a typical Western blot for PC1, PC2, proSAAS, and 7B2 proteins in fed animals, starved animals, and starved animals that received leptin (S+L). A total of 9 animals per condition were used in this study. The lower panels in AD show the compared integrated optical density using NIH Image software for PC1 and PC2 in the 3 brain areas analyzed. ANOVA was followed by a multiple comparison using a Tukey-Kramer test. *P < 0.01, significant difference at this level. Sixty micrograms of total protein was loaded in each well for each condition. The same electrophoretic mobility for PC1 and PC2 molecular mass is indicated at the far right of the upper panels in A and B.
Figure 5
Figure 5
Immunolocalization of PC1 in hypophysiotropic areas of the hypothalamus in fed versus fasting animals. (A and B) Typical photomicrographs showing the immunodistribution of PC1 in the PaLMs and the PaMPs. (C and D) The ME. (E and F) The CC. A significant decrease in PC1 immunoreactivity is shown in the PaMPs (the location of hypophysiotropic TRH neurons) from fasted animals (B) as compared with fed controls (A). See also the high-magnification images at the left of A and the right of B. In the same brain section, the PaLM subdivision, which also expresses PC1, did not change during fasting (A and B; see also the high-magnification images). A and B show low magnification (×10, scale bar: 200 μm). High-magnification images are indicated by arrows (×40, scale bar: 50 μm). The ME region (C and D) shows a strong immunostaining in the internal zone (asterisk) and less intense staining in the external zone (triangle) of the medial portion of the ME in fed animals. Similar changes were observed in the anterior and posterior ME (not shown). The immunoreactivity for PC1 in the CC (E and F) did not show differences between fed and fasted animals (see also insets). CF and insets, ×20, scale bar: 50 μm. 3v, third ventricle.
Figure 6
Figure 6
Immunolocalization of PC2 in hypophysiotropic areas of the hypothalamus during fed versus fasted states. (A and B) Typical photomicrographs showing the immunodistribution of PC2 in the PaLMs and the PaMPs. (C and D) The ME. (E and F) The CC. A significant decrease in PC2 immunoreactivity is shown in the PaMPs (the location of hypophysiotropic TRH neurons) from fasted animals (B) as compared with fed controls (A). See also the high-magnification images at the left of A and the right of B. In the same brain section, the PaLM subdivision, which also expresses PC2, showed a decrease during fasting (A and B; see also the high-magnification images). A and B show low magnification (×10, scale bar: 200 μm). High-magnification images are indicated by arrows (×40, scale bar: 50 μm). The ME region (C and D) shows a weak, unchanged immunostaining in the internal zone and less intense staining in the external zone of the medial portion of the ME in fed as compared with fasted animals. No changes were observed in the anterior and posterior ME (not shown). The immunoreactivity for PC2 in the CC (E and F) did not show differences between fed and fasted animals (see also insets). Magnification in E and F, ×20; scale bar: 50 μm.
Figure 7
Figure 7
Leptin regulates the biosynthesis of the TRH peptide. (A) A typical IHC photomicrograph showing the immunodistribution of proTRH-derived peptides in the PVN and the ME. (B) HPLC separation of PVN and ME protein samples extracted from fed, fasted, and fasted-plus-leptin animals was followed by a specific TRH RIA assay in each fraction collected. Each representative chromatogram displays the elution positions of the synthetic TRH standard. Recoveries were about 95%, and each data point was replicated 3 times. A total of 6 animals per condition were used in this study. ANOVA was followed by a multiple comparison using a Tukey-Kramer test. *P < 0.01, significant difference at this level. (C) The comparative values of T3, T4, and TSH from 20 animals used in each condition. ANOVA was followed by a multiple comparison using a Tukey-Kramer test. **P < 0.001, significant difference at this level.
Figure 8
Figure 8
Fasting alters the posttranslational processing of proTRH. The scheme in A represents a portion of the original processing model for proTRH, where the formation of N-terminal peptide 24 is indicated by the action of PC1 and PC2. The small arrows indicate the sites where PC1 and PC2 produce their enzymatic cleavages. The size of PC1 and PC2 lettering indicates relative activity at a given site. Large arrows indicate the order of processing. (B) An electrophoretic separation on a Tricine SDS-polyacrylamide gel of PVN and ME samples extracted from fed, fasted, and fasted-plus-leptin animals was followed by acid extraction of gel slices and RIA against pEH24 peptide. This RIA recognizes 3 N-terminal moieties derived from proTRH processing, the 15-, 3.8-, and 2.8-kDa (pEH24) forms depicted in A. Molecular masses of the identified peaks are indicated based on the migration of standards and iodinated synthetic pEH24 peptide. These figures represent a typical profile of 3 independent experiments.

Similar articles

Cited by

References

    1. Seidah NG, Chretien M. Eukaryotic protein processing: endoproteolysis of precursor proteins. Curr. Opin. Biotechnol. 1997;8:602–607. - PubMed
    1. Steiner DF. The proprotein convertases. Curr. Opin. Chem. Biol. 1998;2:31–39. - PubMed
    1. Fricker L. Carboxypeptidase E. Annu. Rev. Physiol. 1988;50:309–321. - PubMed
    1. Dong W, Fricker LD, Day R. Carboxypeptidase D is a potential candidate to carry out redundant processing functions of carboxypeptidase E based on comparative distribution studies in the rat central nervous system. Neuroscience. 1999;89:1301–1317. - PubMed
    1. Eipper BA, Stoffers DA, Mains RE. The biosynthesis of neuropeptides: peptide α-amidation. Annu. Rev. Neurosci. 1992;15:57–85. - PubMed

Publication types

MeSH terms